

How To: UEBA with Actor Baselines
User and Entity Behavior Analytics (UEBA) compares activity to what is normal for that specific user or service account, not a one-size-fits-all rule. A 2am login can be routine for a night-shift SRE and highly anomalous for an accountant. Per-entity baselines know the difference.
RunReveal approaches UEBA as something you build on your unified logs with inspectable SQL: automatic hourly actor rollups, z-score style anomaly queries, composable detections, and AI Chat investigations that show their work.
For the architecture narrative behind this model, see Rethinking UEBA for the Modern Cloud.
There is no separate “enable UEBA” toggle. Baselines populate automatically when events include a normalized actor['email']. This guide covers the customer path: Explore → SQL detection → investigation.
What you get out of the box
As events land in logs, ClickHouse incrementally rolls them into ueba_actor_hourly via the ueba_actor_hourly_mv materialized view:
- One row key per workspace, actor email (
principal),sourceType, and hour (hourBucket) - Aggregates: event counts plus unique IPs, countries, ASNs, event names, and resources
- Retention: 550-day TTL on
hourBucket(aligned with default log retention) - Filter: only events where
actor['email'] != ''are included (high-volume email-less sources are skipped)
You do not create or manage the materialized view. You query the table and build detections on top of it.
Prerequisites
- Identity-rich sources with normalized
actor['email'], for example Okta, Google Workspace, CloudTrail (when actor email is present), GitHub, and similar - Optional but useful for geo signals: enrichment that populates
srcASCountryCodeandsrcASNumber - Enough history to baseline (plan on at least 7 days of activity per principal before trusting z-score detections; 30 days is a common window)
Schema: ueba_actor_hourly
| Column | Type | Description |
|---|---|---|
workspaceID | String | Tenant workspace |
principal | String | Actor email from actor['email'] |
sourceType | LowCardinality(String) | Source type for this hour’s activity |
hourBucket | DateTime | Start of hour (toStartOfHour(eventTime)) |
events | SimpleAggregateFunction(sum, UInt64) | Event count in the hour |
ips | SimpleAggregateFunction(groupUniqArrayArray, Array(String)) | Distinct source IPs (capped at insert) |
countries | SimpleAggregateFunction(groupUniqArrayArray, Array(String)) | Distinct srcASCountryCode values |
asns | SimpleAggregateFunction(groupUniqArrayArray, Array(UInt32)) | Distinct srcASNumber values |
eventNames | SimpleAggregateFunction(groupUniqArrayArray, Array(String)) | Distinct eventName values |
resources | SimpleAggregateFunction(groupUniqArrayArray, Array(String)) | Distinct resources (capped at insert) |
AggregatingMergeTree reads: Partial rows can exist until merges complete. Always re-aggregate with sum(events) and groupUniqArrayArray(...) (or equivalent) when grouping by the primary key columns. Do not assume a single physical row per key.
hourOfWeek is not stored. Derive it when needed:
Sample the table
In Explore, confirm baselines are filling:
If this returns no rows, check that your sources populate actor['email'] on events in logs.
Signals vs alerts
UEBA works best when you keep signals (observations worth recording) separate from alerts (things that should page someone):
| Signal | Alert | |
|---|---|---|
| Meaning | A notable deviation or observation | A signal (or combination) that crossed your action threshold |
| Notifications | None | Slack, email, PagerDuty, etc. |
| Use | Tuning, hunting, feeding stronger detections | Incident response |
In RunReveal, both appear as detection results. Prefer starting UEBA volume detections as signals, then promote noisy-but-true patterns to alerts after tuning. See Detections, Signals, and Alerts.
Step-by-step: anomalous hourly volume
Step 1: Explore a z-score query
The following query flags hours where an actor’s event volume is more than 3 standard deviations above their own mean for that sourceType over the selected window:
Run it in Explore with a 7–30 day range. Expect results in tens of milliseconds once baselines exist; the expensive historical scan already happened in the background MV.
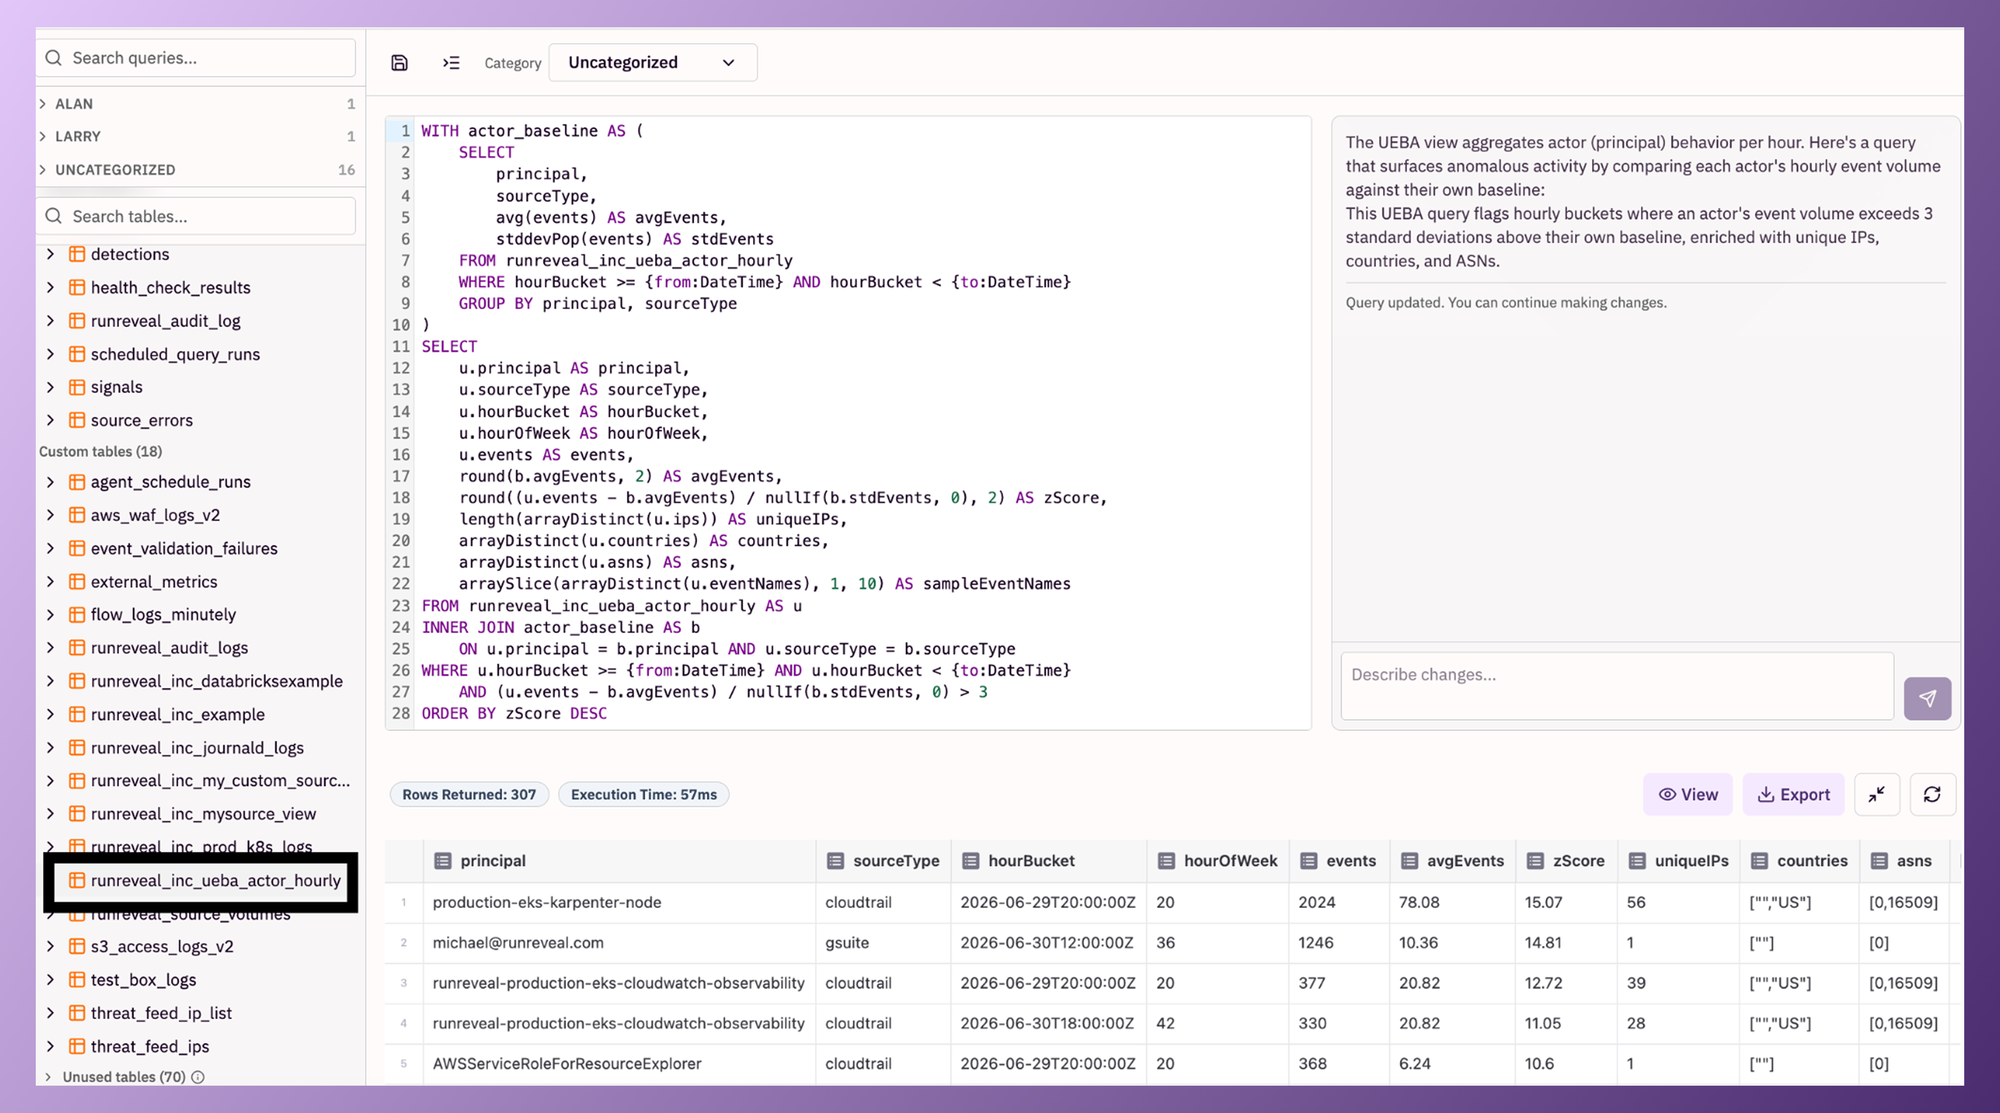
In Explore, you should see the ueba_actor_hourly table available to query.
Step 2: Register a daily volume detection
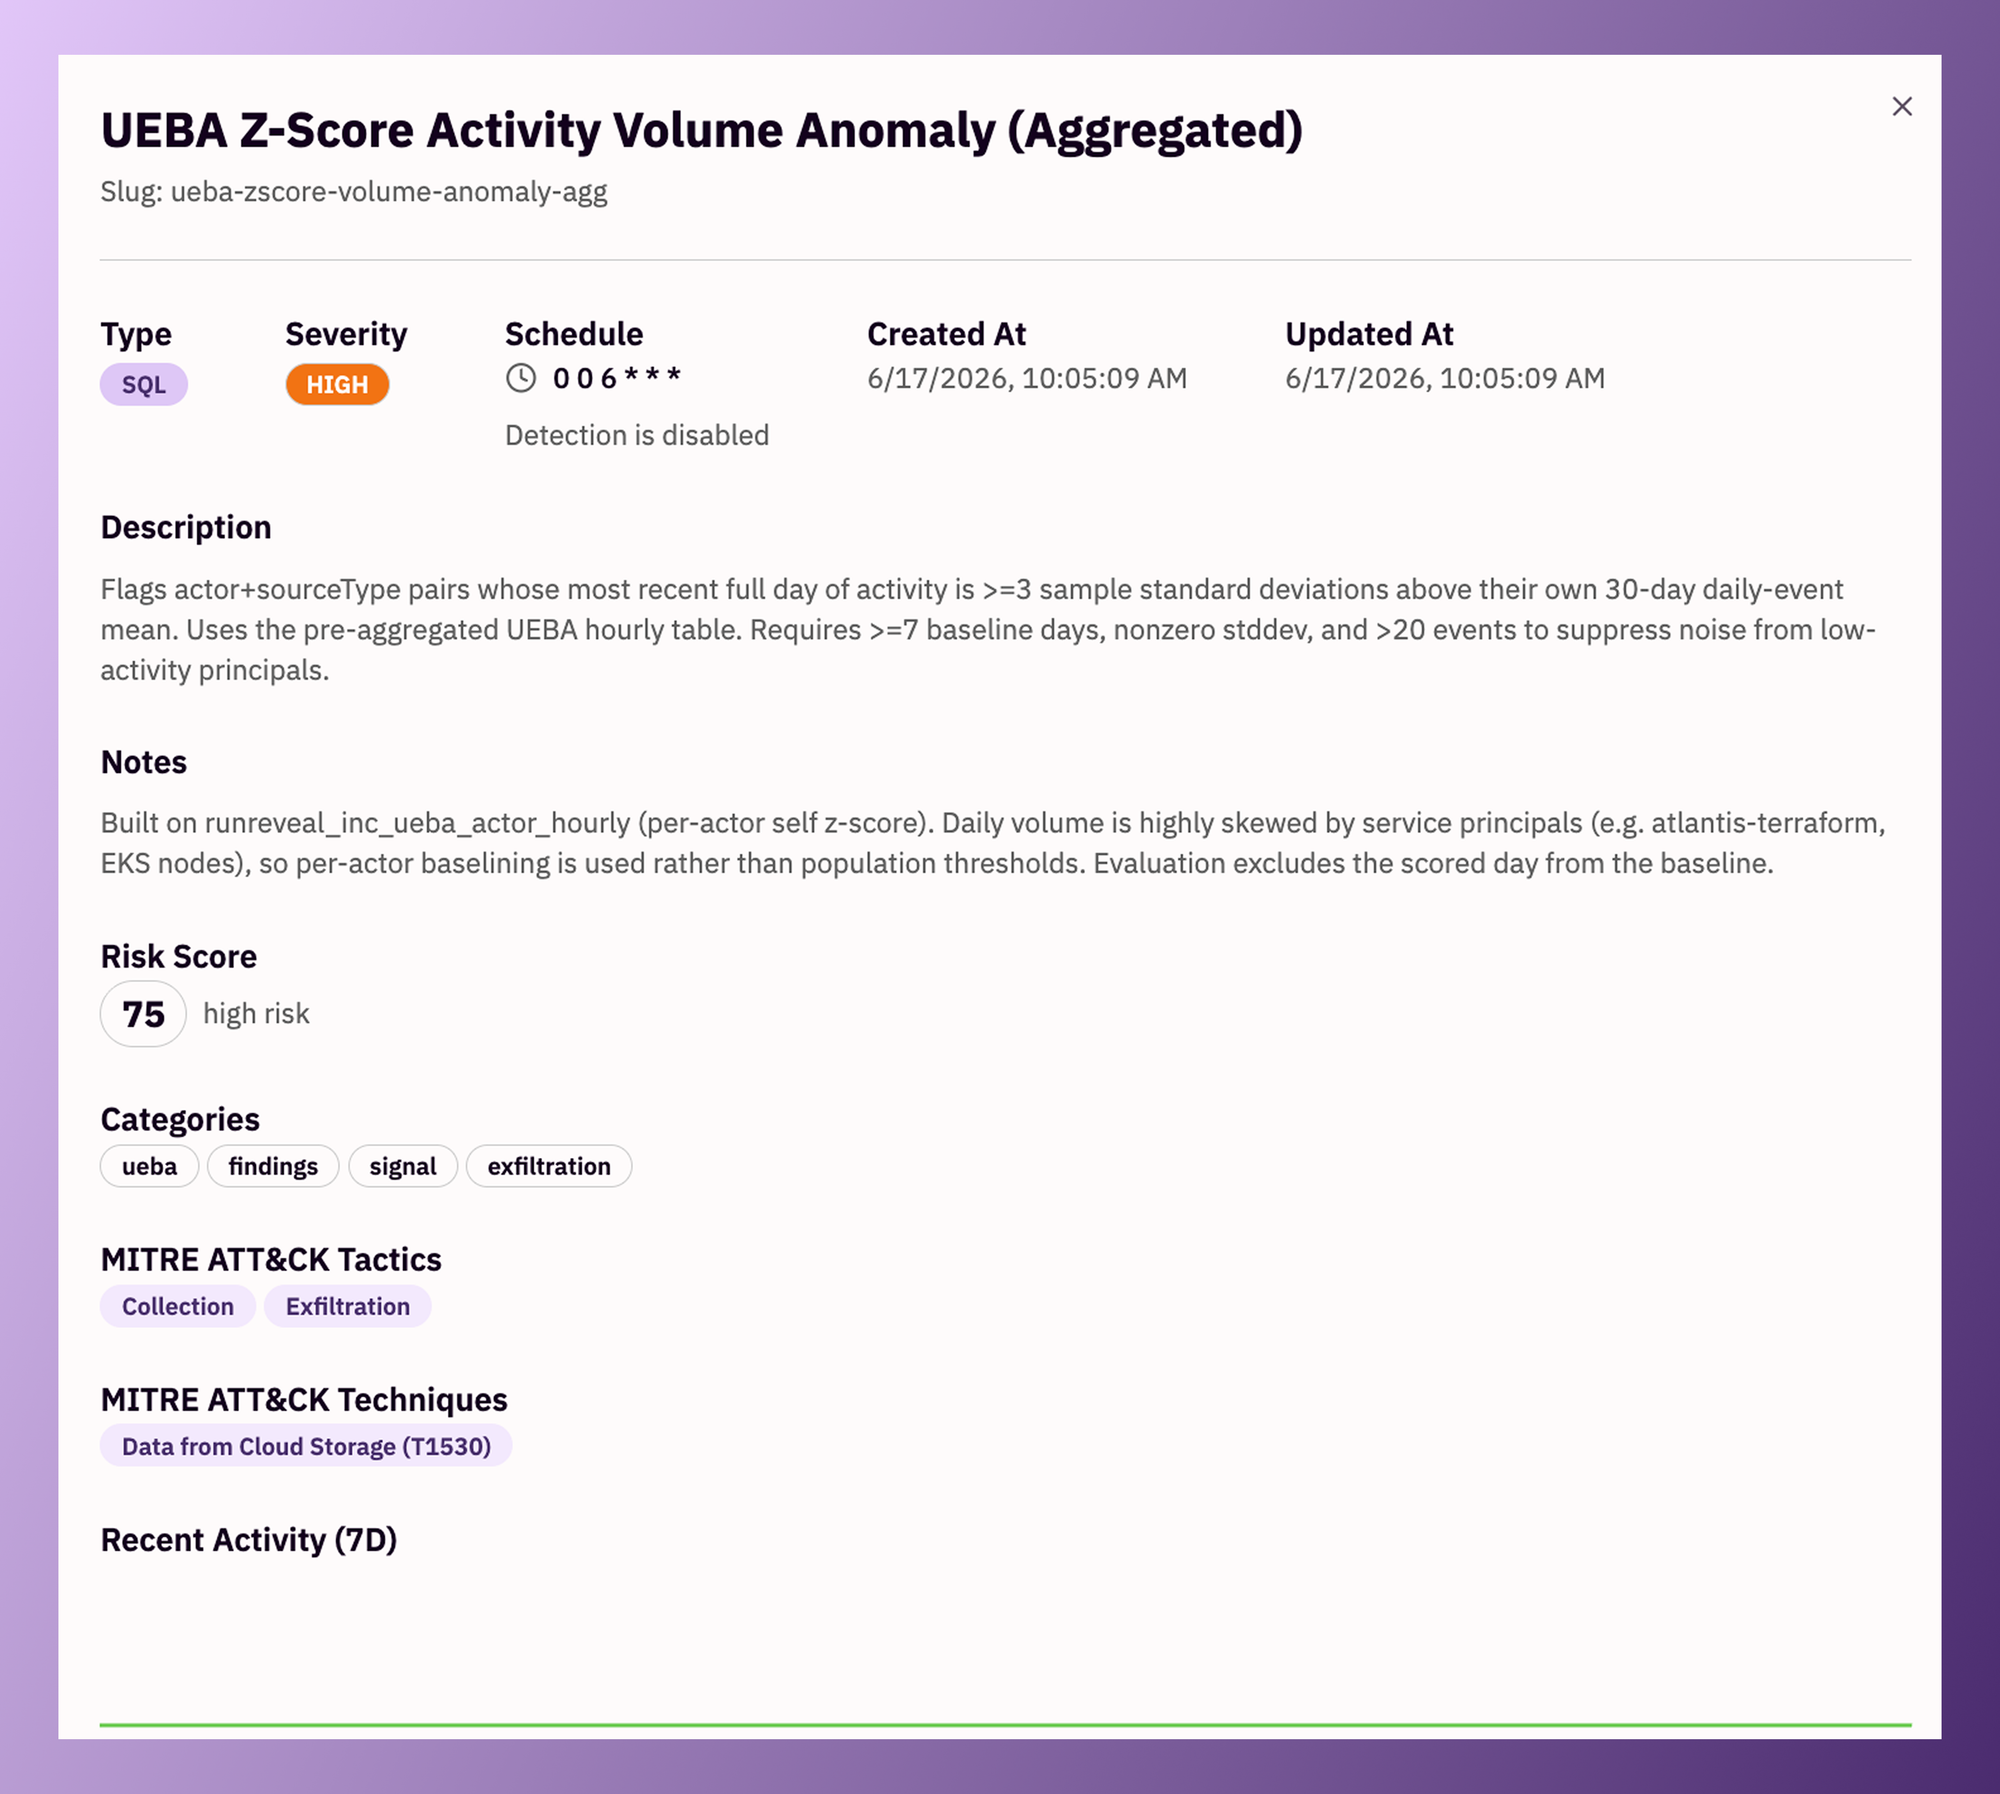
A single noisy hour is often automation. A full day that is still ≥3 sample standard deviations above that actor’s own daily mean is a stronger signal. Create a SQL detection with a daily schedule (for example 0 0 6 * * *) using logic like this:
Suggested detection metadata:
| Field | Example |
|---|---|
| Display name | UEBA Z-Score Activity Volume Anomaly |
| Type | SQL |
| Severity | High (or start as a signal / lower severity while tuning) |
| Categories | ueba, plus your usual classification tags |
| Notes | Per-actor self baseline (not population-wide) because service principals skew daily volume |
Tuning knobs (edit the SQL, not a black-box model):
daysSeen >= 7: minimum baseline daysdayEv > 20: suppress low-activity noise>= 3: z-score threshold (raise to 4–5 to reduce false positives)- Exclude known automation principals with
AND l.principal NOT IN (...)orNOT match(l.principal, ...)
Start without notification channels (signal). After a week of review, attach channels to promote true positives to alerts.
Step 3: Investigate with AI Chat
When a principal lights up, open Native AI Chat (or the detection’s investigation / triage flow) and ask a reproducible question, for example:
What did
[email protected]do across all sources in the last 24 hours? Summarize new countries, unusual event names, and any privileged actions. Show the queries you ran.
Useful follow-ups:
- Compare this actor’s last day on
ueba_actor_hourlyto their 30-day mean for eachsourceType - List distinct countries and ASNs for this principal in the last 7 days vs the prior 30
- Pull raw
logsfor the topeventNamesfrom the anomalous hour
AI answers should cite the queries and tables they used so you can validate and turn good paths into agents or saved detections.
More UEBA patterns to try
Once volume baselines work, compose additional SQL detections on the same table (and join back to logs when you need raw context):
| Pattern | Idea |
|---|---|
| New country | Country appears in today’s countries array but not in the prior N days for that principal |
| New ASN / IP burst | Spike in length(arrayDistinct(ips)) or new ASN vs baseline |
| First-seen event name | eventNames contains an action never seen for that principal+sourceType |
| First-seen resource | New value in resources (cloud buckets, repos, etc.) |
| Off-hours | High events in hourOfWeek buckets that are rare for that principal |
Keep each building block modest. Correlate in a higher-level detection or investigation when combinations matter (unusual login + token creation + privileged API calls).
Best practices
- Baseline per principal, not against the whole org. Service accounts and CI bots will dominate population stats
- Prefer signals first, then alerts after you have history and exclusions
- Document thresholds in detection notes so the next analyst can audit why
>= 3anddayEv > 20were chosen - Ensure
actor['email']quality on critical sources; empty emails never enterueba_actor_hourly - Give the MV time after connecting new sources. There is no automatic historical backfill of the baseline table from before the MV existed
- Investigate with receipts: use AI Chat and Explore side by side; do not trust a score you cannot re-query
Related
- Blog: Rethinking UEBA for the Modern Cloud
- Writing detections
- Detections, Signals, and Alerts
- Native AI Chat
- Agents: schedule recurring hunts (for example Weekly Threat Hunt)