RunReveal Onboarding Guide
RunReveal is a modern security data platform built on ClickHouse that eliminates traditional SIEM complexity while delivering detection-as-code, AI-powered investigations, and sub-second query performance at scale. This guide walks you through setting up your workspace, connecting data sources, configuring detections, and getting your team productive with RunReveal.
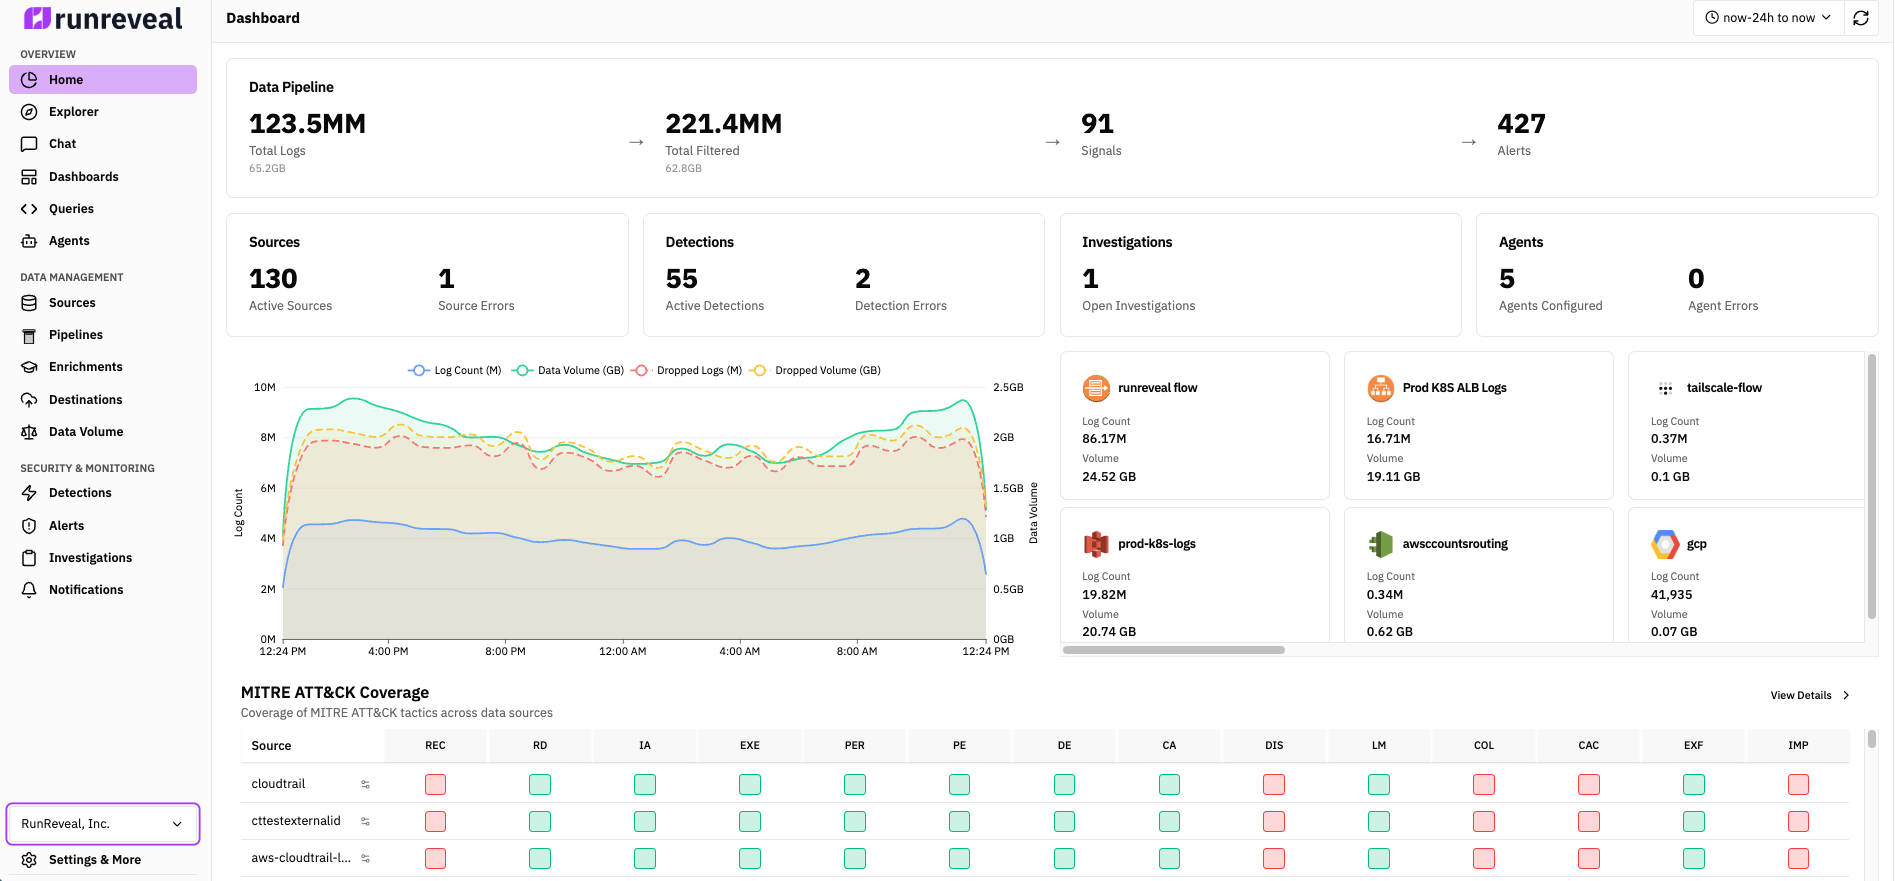
Platform at a glance
As you work through this guide, keep these capabilities in mind—they map to the rest of the documentation:
- Sources — Ingest from SaaS APIs, object storage, webhooks, and forwarders
- Pipelines & topics — Route, transform, filter, and enrich events before storage and detection
- Detections — SQL schedules and Sigma streaming; detection as code via the CLI
- Signals and alerts — Tune with signals; escalate to alerts with notifications
- Investigations — Central workspace for queries, alerts, AI chat, and notes
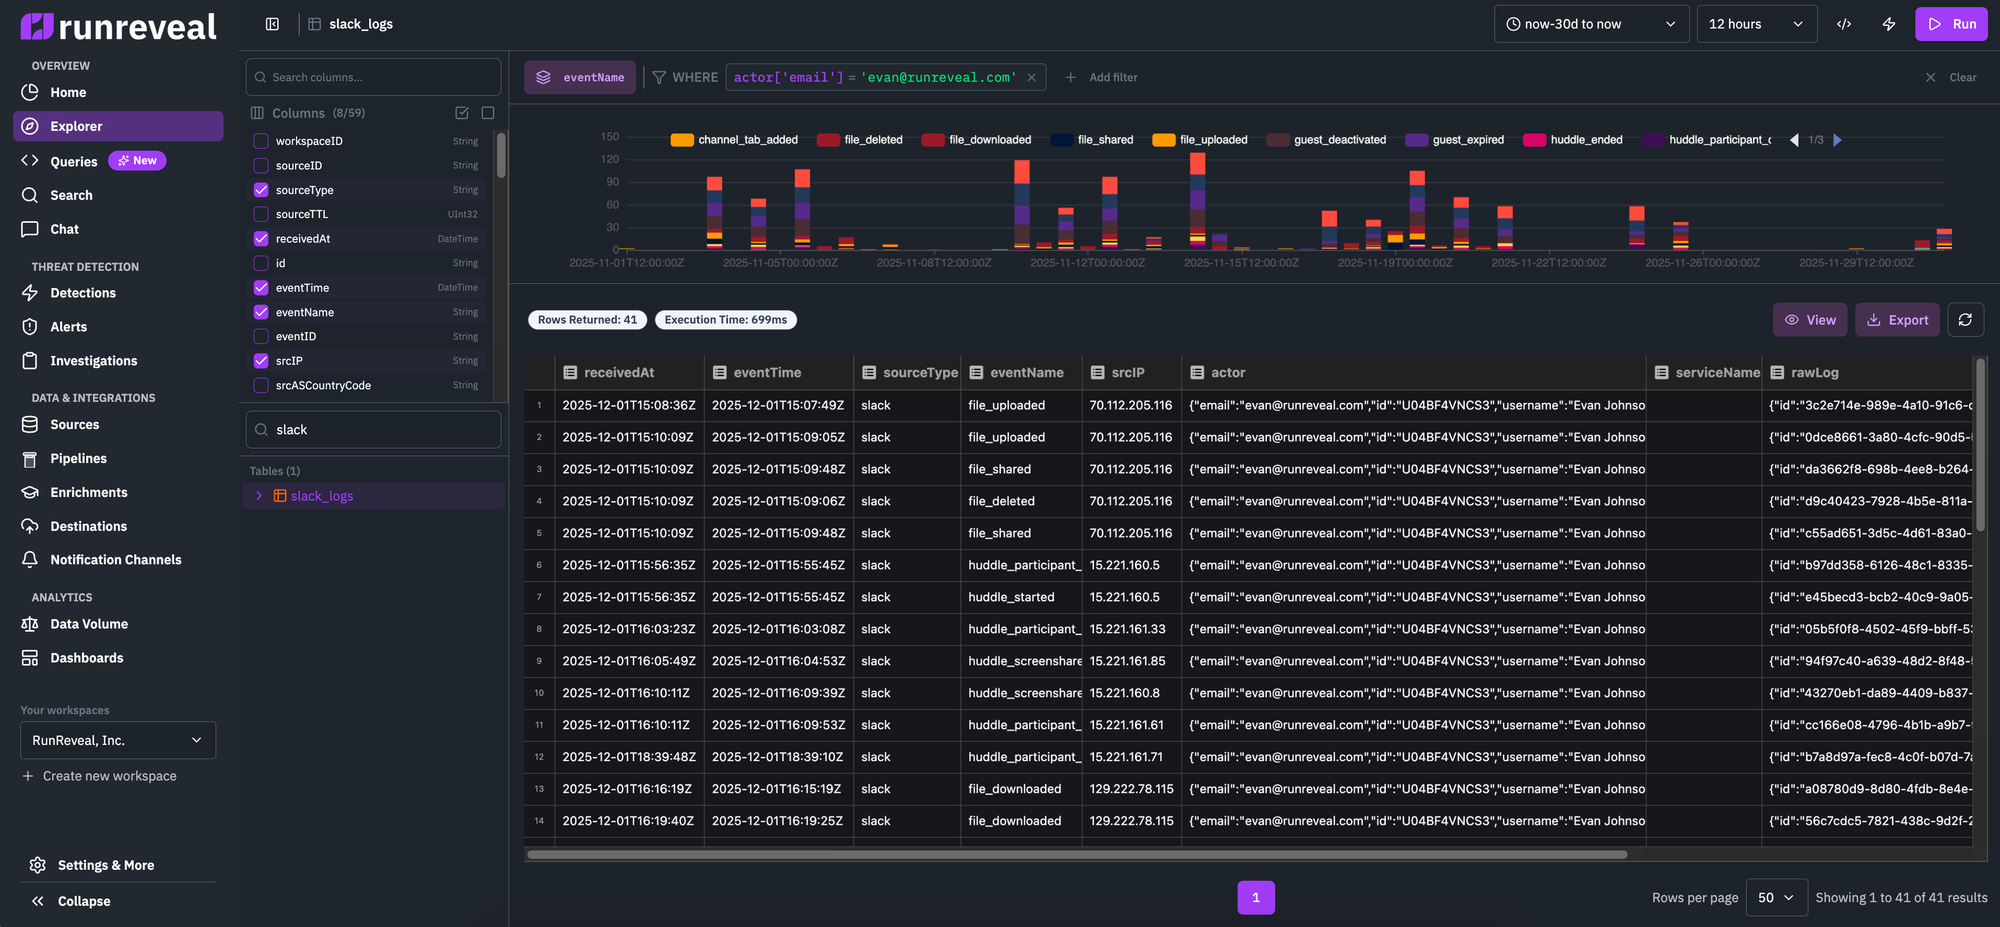
- Search / Explorer — SQL and saved queries on your log data
- AI Chat — Natural-language help for queries and analysis
- Dashboards — Charts and tables driven by SQL
- Reference — SSO, RBAC, audit logs, Logs API, and the CLI
How Logs Flow Through RunReveal
Connect Sources
Collect logs from 100+ sources
Webhooks
Vector, Fluent Bit
API Polling
Okta, GitHub
Object Storage
S3, R2, GCS, Azure
Topics
Filter logs to flow through different pipelines
Pipelines
Configure transforms, enrichments, filtering, and sampling
ClickHouse
Cloud, BYOC, or On-Prem
Destinations
External storage
Detections
Sigma & SQL
Signals
No notification
Alerts
With notifications
Investigations
Manual + auto triage
Notification Channels
Slack, PagerDuty, Jira
ClickHouse
Cloud, BYOC, or On-Prem
Destinations
External storage
Detections
Sigma & SQL
Signals
No notification
Alerts
With notifications
Investigations
Manual + auto triage
Notification Channels
Slack, PagerDuty, Jira
AI Chat, MCP Server, & Agents
Natural language queries, Model Context Protocol, and autonomous workflows — same data, separate from the pipeline above.
Onboarding Steps
Step 1: Create Your Account and Workspace
Sign up at app.runreveal.com, complete account setup, and verify your workspace appears in Settings → Workspace Settings. For now, defer team invitations and API tokens to Step 8.
See Managing Users and Role-Based Access Control for governance details.
Step 2: Connect Your First Source
Start with a source that gets you to value quickly (Okta, CloudTrail, GitHub, or Google Workspace).
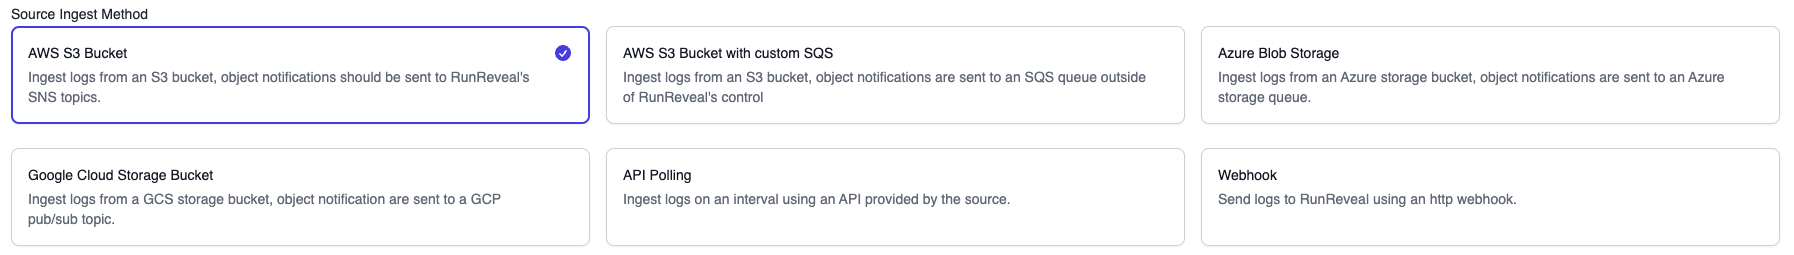
- Go to Sources → Add Source.
- Pick your source and complete its wizard.
- For API sources: set credentials, click Test Connection, then Save.
Use least-privilege credentials for all integrations. See Sources and Source Types.
Step 3: Validate Data Flow
Confirm data quality before creating detections:
- In Sources, check source status.
- Open Sources → [your source] → Health Checks and verify connectivity + recent receipt timestamps.
- Run this query in Explore Logs:
If no rows appear after a few minutes, check Health Checks first.
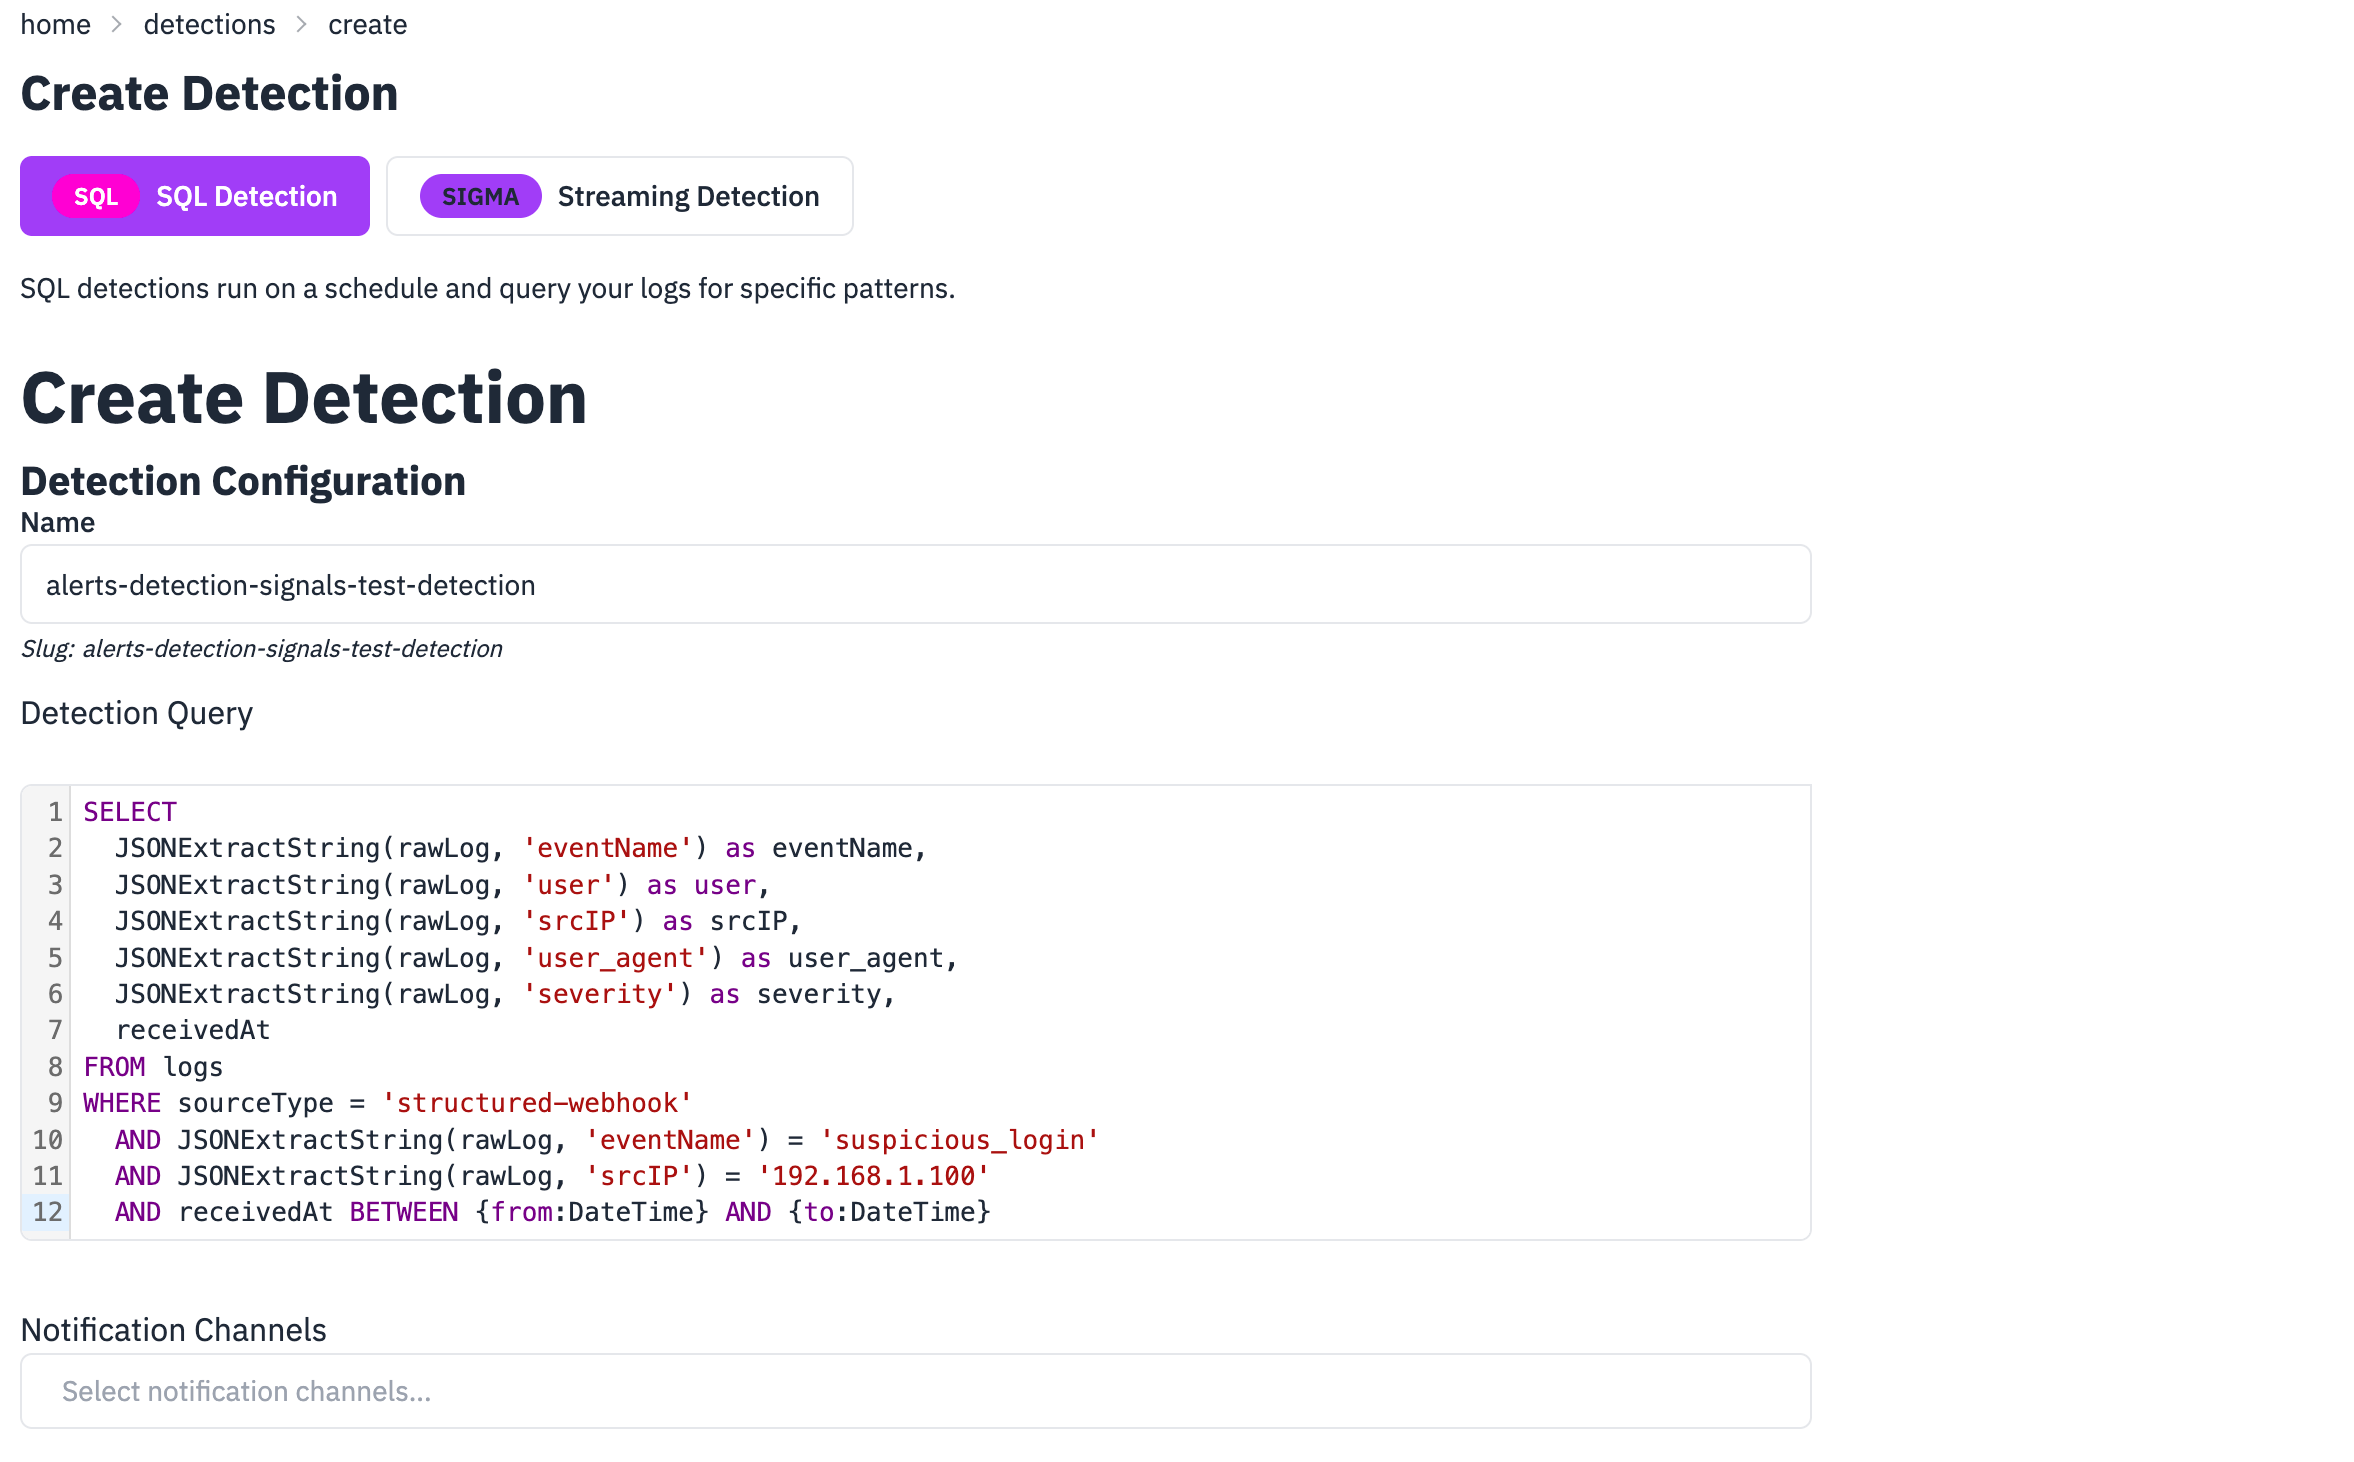
Step 4: Create Your First Detection
Create a SQL detection on real source data (not synthetic webhook test data).
Example (Okta failed logins by source IP):
Suggested config:
- Name:
okta-failed-logins-by-ip - Schedule:
*/5 * * * * - Severity: Medium
- Categories:
authentication,brute-force - Notification Channels: leave empty initially (signals only)
See Writing Detections, Detections Quick Start, and Sigma Streaming.
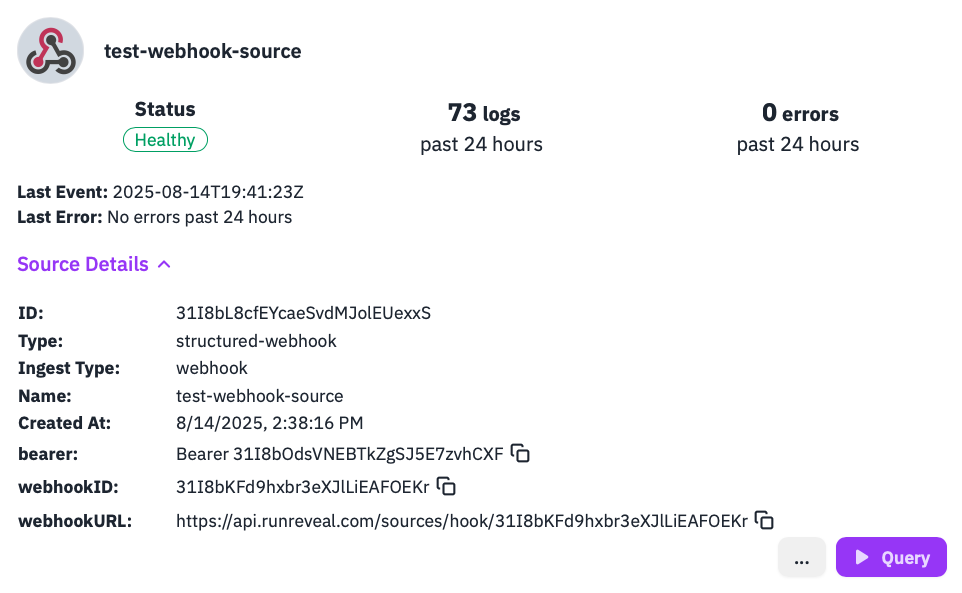
Step 5: Optional — Trigger a Detection with a Webhook Generic Logs Source
Use this step when you want to force a known-positive match quickly (for demos, validation, or low-volume environments).
- Go to Sources → Add Source → Webhook Generic Logs and create a source.
- Copy the webhook URL (and bearer token if enabled).
- Create a test SQL detection named
webhook-suspicious-login-test:
- Send a test event to the webhook:
- Verify the detection fired:
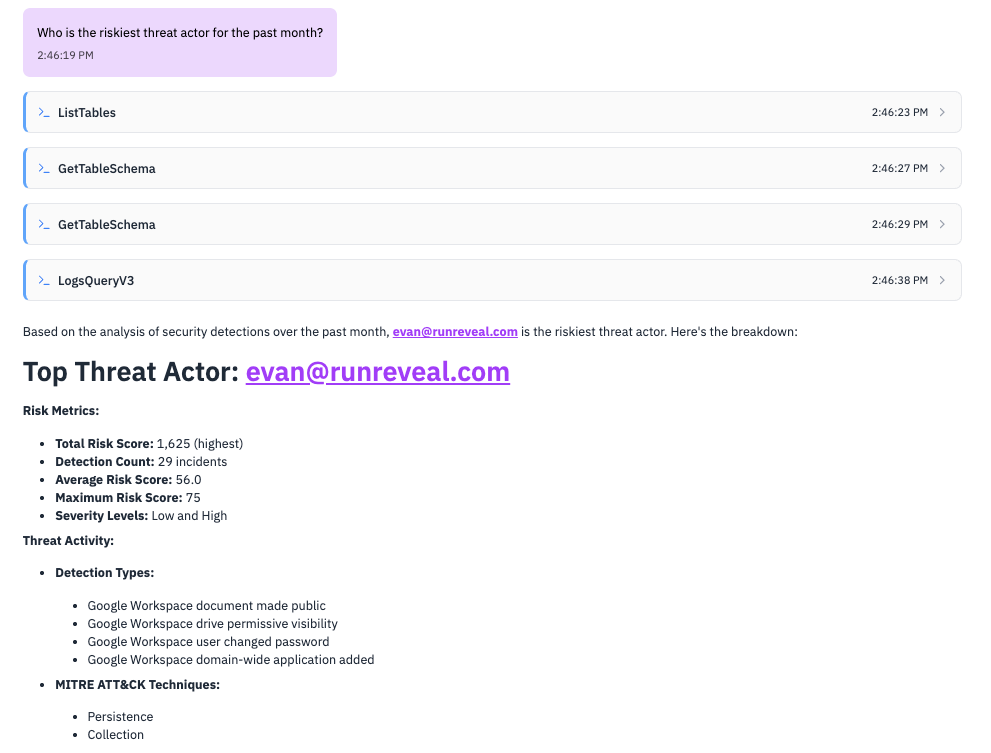
Step 6: Investigate with AI Chat
Now that you have detections configured, use AI Chat to explore data and detection outcomes faster.
- Configure a model provider in Workspace Settings → AI Model Providers.
- Open Chat and ask:
- "What are the most common event types in the last 24 hours?"
- "Show failed logins from unusual locations."
- "Which sources are sending the most volume?"
- Reuse generated SQL to improve detections and dashboards.
See Native AI Chat and Model Context Protocol.
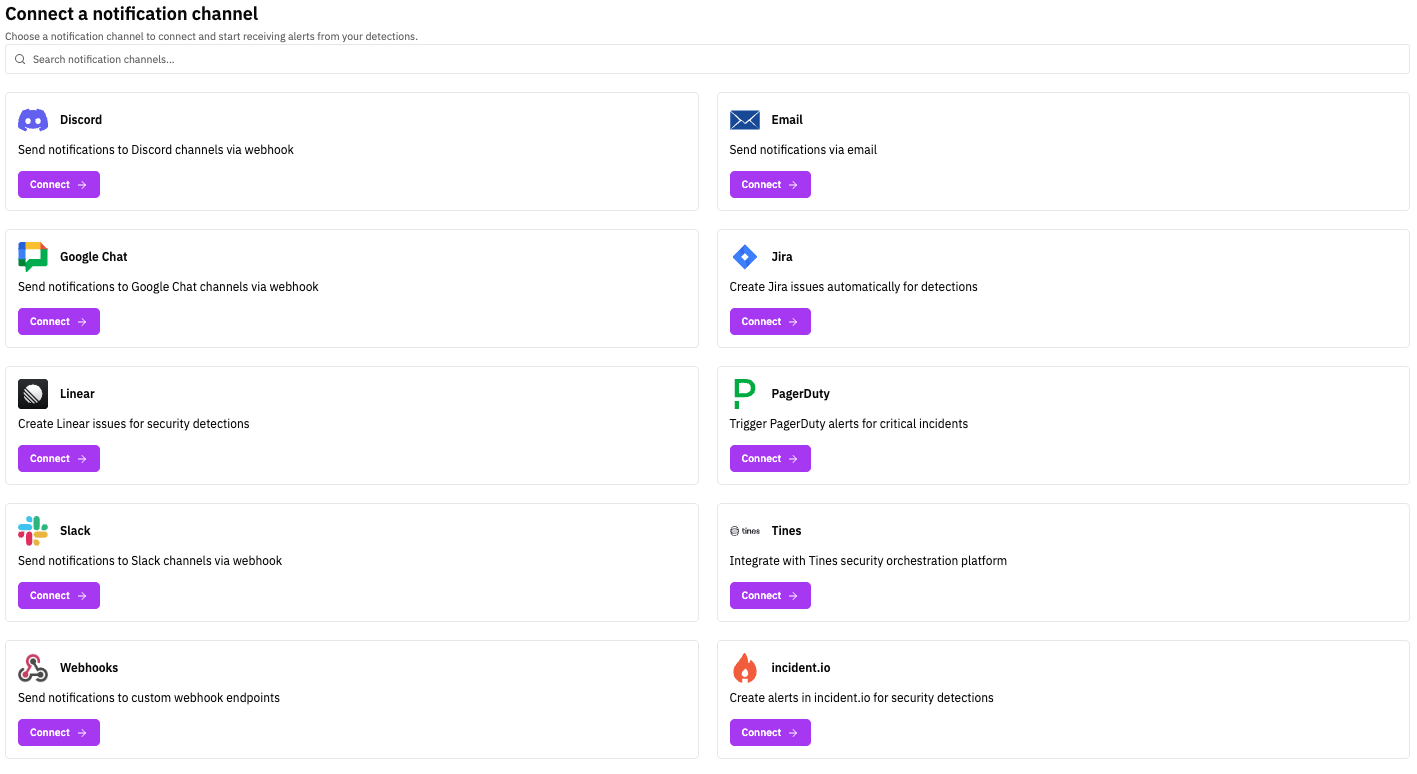
Step 7: Configure Notifications and Promote Signals to Alerts
Once your detection works, attach channels so matching results become alerts:
- Go to Notification Channels → Add Channel.
- Configure Slack, Email, PagerDuty, Jira, Linear, or Webhooks.
- Edit your detection and attach one or more channels.
- Save and wait for next run (or trigger manually).
See Notifications Getting Started, Slack, and Templates.
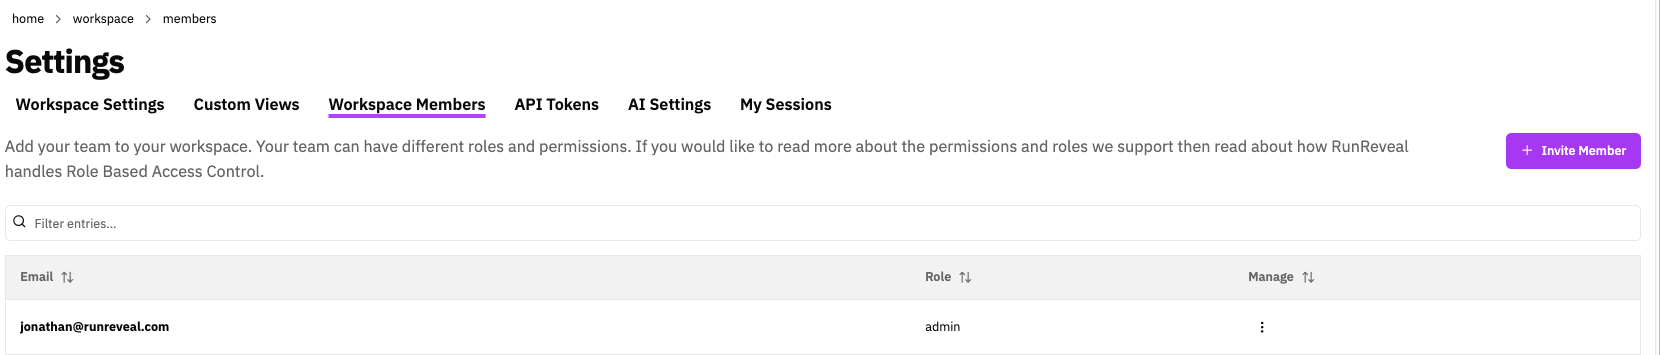
Step 8: Invite Team and Configure Access
Now that you have working ingest + detections, add collaborators:
- Go to Settings → Workspace Members → Invite User.
- Assign the right role:
- Admin: workspace/platform owners
- Analyst: detection authors and SOC analysts
- Operator: read-only investigators/reporting
- CIBot: automation/service account workflows
- Optional: configure SSO and API tokens.
See Managing Users, RBAC, and Single Sign-on.
Step 9: Connect More Sources and Tune Log Processing
Expand coverage (identity, cloud infra, endpoint, and network), then tune ingestion:
- Pipelines with topic routing
- Transforms to normalize data
- Filtering for reusable noise controls
- Enrichments to add context
- Sampling for high-volume optimization
- Drop for permanent discard of zero-value events
- Destinations to stream data to external storage
- Custom Views for frequently used investigative slices
Optional topic/pipeline example: create a topic for noisy infrastructure logs and add a Drop step with eventName regex: ^(healthcheck|heartbeat)$.
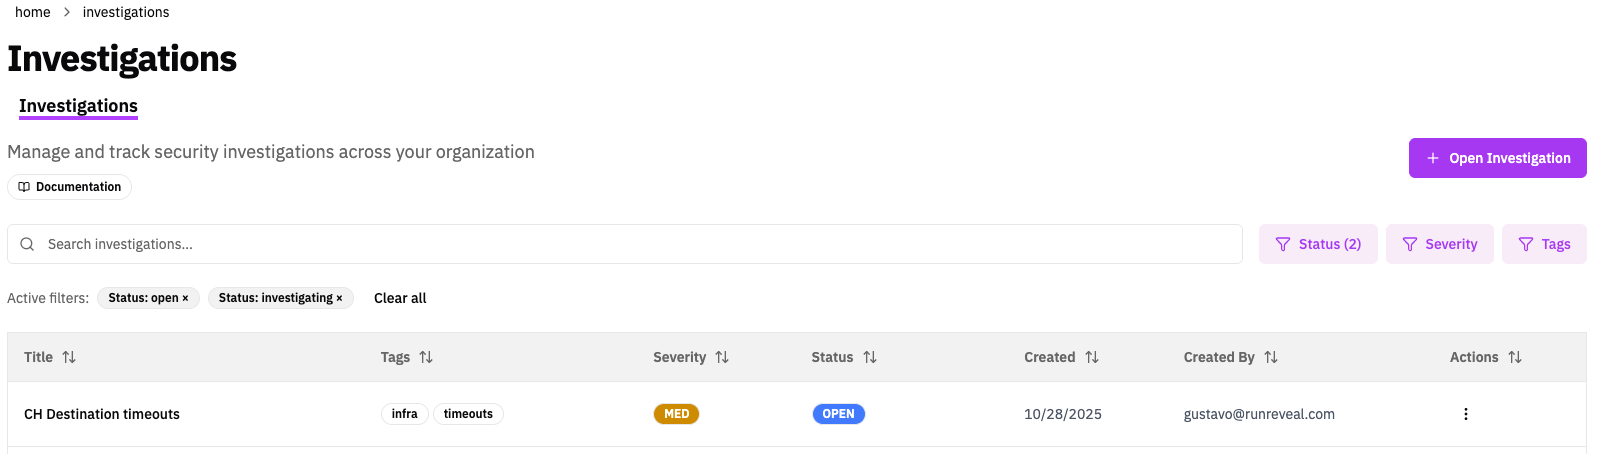
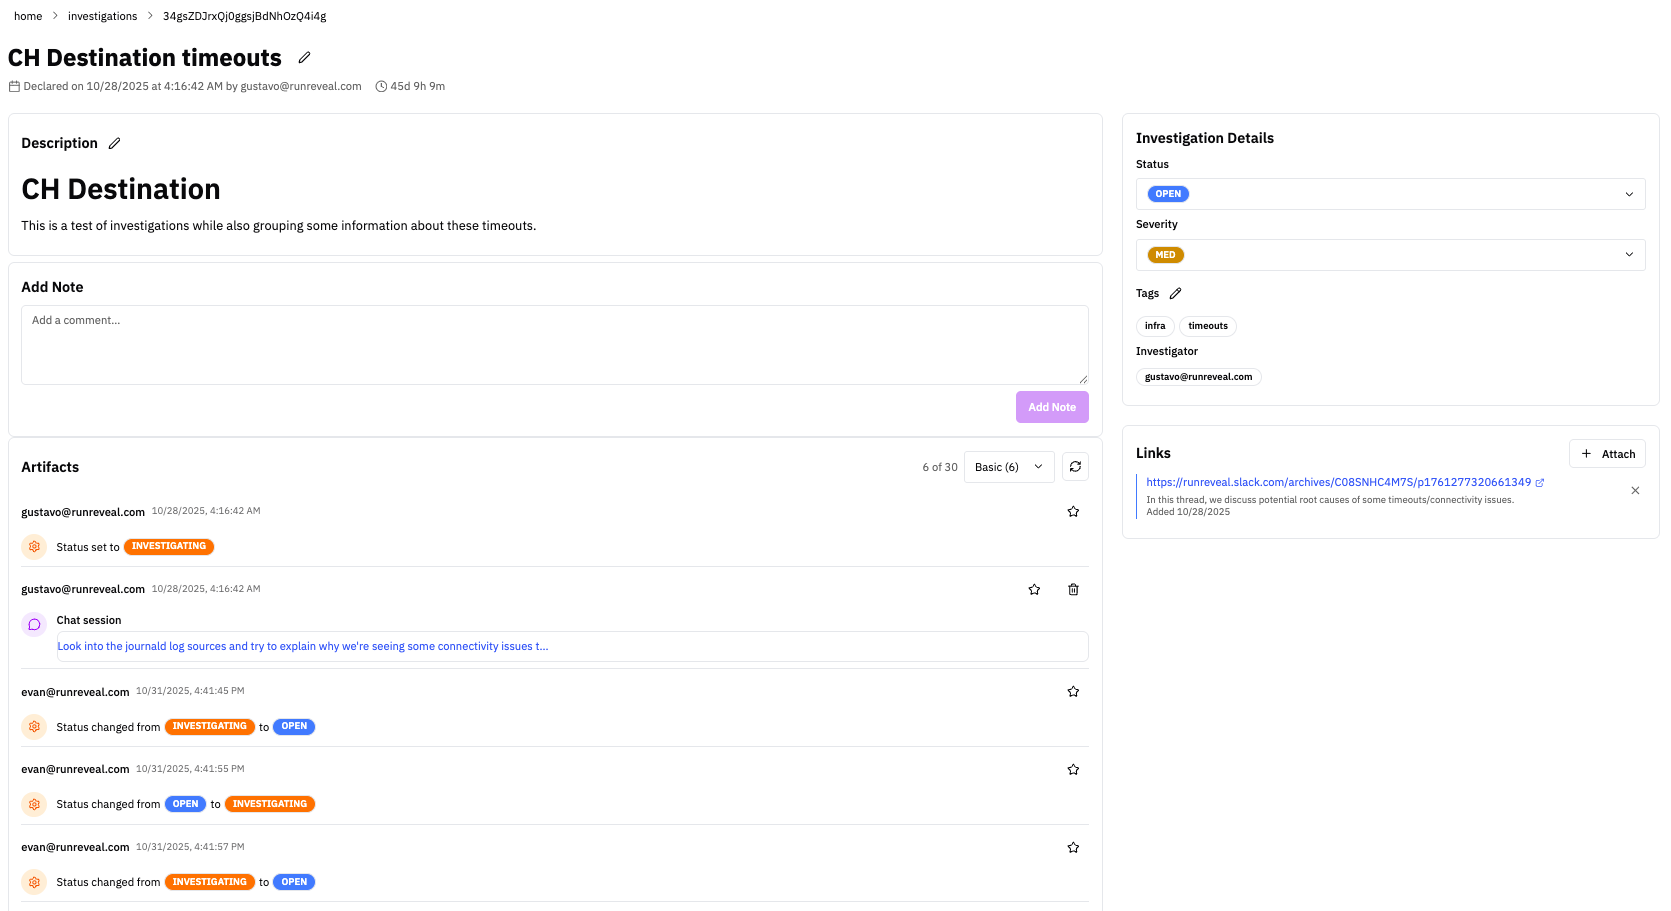
Step 10: Set Up Investigations and Optional Automated Triage
Use Investigations for structured incident response:
- Create an investigation manually in Investigations.
- Add artifacts: query links, alerts, AI chat findings, and notes.
- Optional: enable AI triage in detections and assign an agent.
See Investigations and Agents.
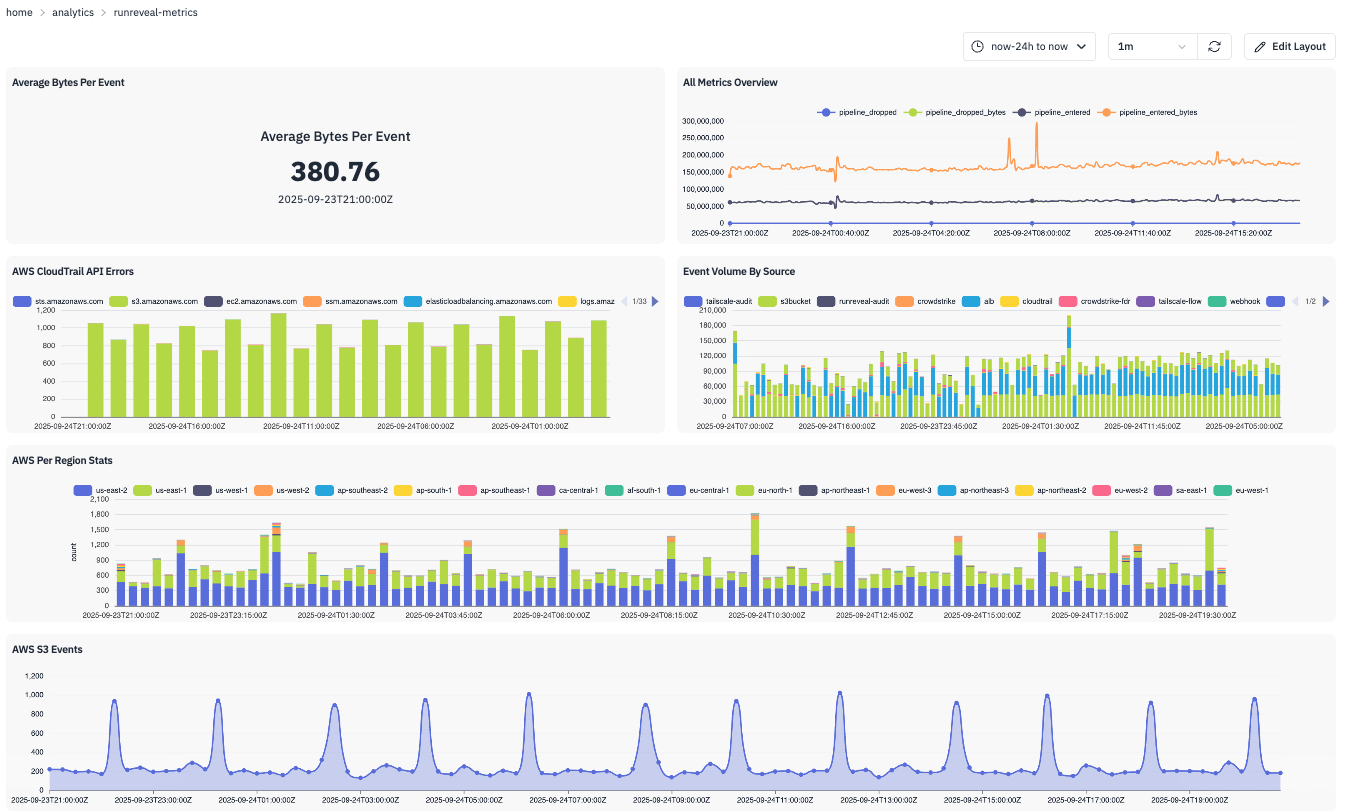
Step 11: Build Dashboards and Scheduled Agents
Create persistent visibility and recurring analysis:
- Build a dashboard in Dashboards → Create Dashboard.
- Add SQL-backed widgets (time series, counters, tables).
- Configure scheduled agents for daily/weekly summaries and hunting prompts.
See Dashboards, Agents, and Prompts.
Step 12: Adopt Detection-as-Code (Recommended)
Move detections into version control for safer deployment workflows.
See Detection as Code, Getting Started, and Deployment.
Step 13: Integrate External Tools (Optional)
Connect RunReveal to your broader tooling:
| Integration | Docs |
|---|---|
| MCP Server for Cursor, Claude, and Claude Code | Model Context Protocol |
| Grafana | Grafana |
| Jupyter Notebooks | Jupyter |
| Tines / incident.io | Tines · incident.io |
| Notification Webhooks | Webhooks |
Helpful Links
Now that you have completed RunReveal onboarding, explore the detailed configuration guides:
- Detections — Create and manage security detection rules
- Sigma Streaming — Sigma rules for streaming detection
- Detection as Code — Manage detections through code and version control
- Quick Start: Detections, Signals, and Alerts — Hands-on signals vs alerts tutorial
- Sources — Data collection from your systems and forwarders
- Pipelines — Topics, routing, and processing steps
- Explore Logs — Search, Explorer, and saved queries
- Investigations — Incident workspaces and collaboration
- Notifications Getting Started — Alerting and notification channels
- AI Chat — AI-powered analysis for threat hunting and investigation
- Enrichments — Add context and metadata to your security events
- Logs API — Programmatic SQL queries over HTTP
- API Reference — Full REST API reference and machine-readable OpenAPI specification
- Single sign-on — SSO configuration
- Role-based access control — Roles and data access