

Destinations
Destinations are the storage endpoints you can send events to (workspace ClickHouse, additional ClickHouse clusters, or object storage). Which destinations receive an event is determined by your pipeline: add one or more Destination steps so matching events are routed explicitly. Configure the destinations themselves under Destinations in the app; use Pipelines to choose where each topic’s events go.

Default pipeline: New and migrated pipelines include a Destination step targeting RunReveal Backend (the workspace ClickHouse used for Explore and detections). Replace or add steps when you want object storage, an additional ClickHouse cluster, or S3-only routing.
Destination Types
ClickHouse
ClickHouse destinations store events in a ClickHouse database for real-time querying, analysis, and all RunReveal features. You can configure multiple ClickHouse destinations, with one marked as the default.
Use cases:
- Primary data storage for querying and analysis
- Custom ClickHouse instances for specific workflows
- Data replication across multiple databases
To connect a ClickHouse Cloud service by signing in with ClickHouse, you need Admin data access on that service. See Connect a ClickHouse Cloud Service.
Object Storage (S3, R2, GCS)
Object storage destinations write events to cloud storage buckets for archival, backup, and long-term retention.
Supported providers:
- Amazon S3: Write logs to S3 buckets
- Cloudflare R2: Write logs to R2 buckets
- Google Cloud Storage: Write logs to GCS buckets
Use cases:
- Long-term archival of log data
- Backup and disaster recovery
- Compliance and retention requirements
- Cost-effective storage for historical data
Configuration
Destinations are configured in the RunReveal UI under Destinations. Each destination requires:
- Name: A unique identifier for the destination
- Type: ClickHouse or object storage provider
- Settings: Type-specific configuration (connection details, bucket names, paths, etc.)
- Credentials: Authentication information (stored securely)
ClickHouse Configuration
- Host: ClickHouse server address
- Port: ClickHouse server port
- Database: Target database name
- Credentials: Username and password, or SPIFFE/mTLS authentication
- Default destination: Mark as default (only one can be default)
SPIFFE/mTLS Authentication
For enhanced security, ClickHouse destinations can use SPIFFE-based mTLS authentication instead of username/password credentials. This enables certificate-based authentication with automatic certificate rotation.
Benefits:
- No password management required
- Automatic certificate rotation
- Stronger authentication through mutual TLS
- Integration with SPIFFE/SPIRE identity systems
To enable SPIFFE authentication for a destination:
- Toggle the Use SPIFFE Authentication option when creating or editing a ClickHouse destination
- Ensure the ClickHouse server is configured to accept certificate-based authentication
- The username field specifies which ClickHouse user to authenticate as (sent via the
X-ClickHouse-Userheader)
SPIFFE authentication requires server-side configuration. See the BYOC Deployment guide for details on configuring SPIFFE certificate paths.
Object Storage Configuration
- Provider: S3, R2, or GCS
- Bucket/Container: Storage bucket or container name
- Path: Optional prefix for where logs are written in the bucket/container
- Credentials: Provider-specific authentication (access keys, service accounts, etc.)
You can set different prefixes per destination. For example, one destination can write to logs/security/ and another to logs/archive/ so each route lands in its own path.
Destination pipeline step
Use Destination steps when you need specific routing outcomes per event stream. For example, you can keep security-critical logs in RunReveal Backend for detections and investigations, while also writing a copy to object storage for long-term retention, compliance export, or lower-cost archival. Destination steps let you control this per topic and per precondition instead of treating all logs the same.
Pipelines control routing. Add a Destination step for each output you want; steps run in order, and multiple Destination steps can appear in the same pipeline to fan out the same event to more than one place (for example, workspace ClickHouse plus an S3 archive).
If you want "destination A for one subset, destination B for everything else," use step preconditions to split the flow:
- First Destination step: target destination A with a specific precondition.
- Next Destination step: target destination B with the opposite precondition (or another condition that captures the remaining events).
Destination steps do not stop pipeline execution. Later steps still run, so use preconditions intentionally to avoid sending the same event to both destinations unless that is what you want.
When you configure a Destination step, you select which destination ID to attach to the event:
- RunReveal Backend: the workspace’s primary ClickHouse database (multi-tenant or BYODB). This default target does not send to object storage by itself.
- Custom Destinations: any other destination you created (custom ClickHouse, S3, R2, GCS, and so on). To archive to S3, add a Destination step that selects that S3 destination’s ID.

To set per-event retention in days in ClickHouse (independent of which destination receives the data), add a Set TTL step in the same pipeline.
Health Checks
A destination health check counts write failures for a destination you configured and alerts when that count stays too high. RunReveal runs the check on a schedule, counts errors from the previous interval, and notifies the channels you chose once the count is at or above your threshold for enough runs in a row.
To watch whether a source is still sending logs, use Source Health Checks.
Checks are optional. Creating a destination does not add one. Test Connection and Verify Bucket Configuration on the destination form run once, when you click them. The health check is the monitor that keeps running after that.
The built-in RunReveal Backend row (the workspace ClickHouse shown when you have not added your own ClickHouse destination) has no actions menu. Add checks on a ClickHouse, ClickHouse Cloud, S3, R2, or GCS destination you created.
Where to add a check
Open Destinations in the app:
You can edit checks in either place:
- Open the destination and scroll to Destination Health Checks. Click Add Health Check. Changes on this form are saved when you click Connect or Update. If the destination saves and a check does not, the app reports how many checks failed to save. Open the destination again and save the check.
- On the destinations list, open the row menu (
…) and choose Health Checks. Add, edit, and delete on this page are saved immediately. Overview on that page returns to the destination form.
Clicking a ClickHouse Cloud row opens its storage panel (disk use, row counts, server version, and uptime, read with that destination's credentials). More → Health checks on that panel opens the same health checks page. If the panel cannot connect, it tells you to check that the service is running and that its connection settings are current. That message is a live read of the service. It is separate from the scheduled write-error check.
The only check type today is Destination Write Errors. When it is the only type, the form opens on it directly. You can add more than one check on the same destination (for example a tight interval on a low threshold, and a longer interval on a higher one).
Saving, silencing, or deleting a check requires permission to edit destinations.
What counts as a write error
RunReveal records a destination error when it cannot open that destination (a bad address, credentials, or similar setup failure) or cannot write a batch of events to it. Each recorded failure counts as one error. A batch that contained many events is still one error.
The check counts those records for the destination over the previous check interval. A check that runs every 15 minutes counts errors from the previous 15 minutes. The check fails when the count is greater than or equal to Error Threshold.
A failed custom view sync on a ClickHouse destination is stored as a destination error on that destination, so it counts toward the same check.
Configuration
The Configure Destination Write Errors dialog opens with the defaults below. Check Interval is set to Every 15 minutes, and Error Threshold is 5.
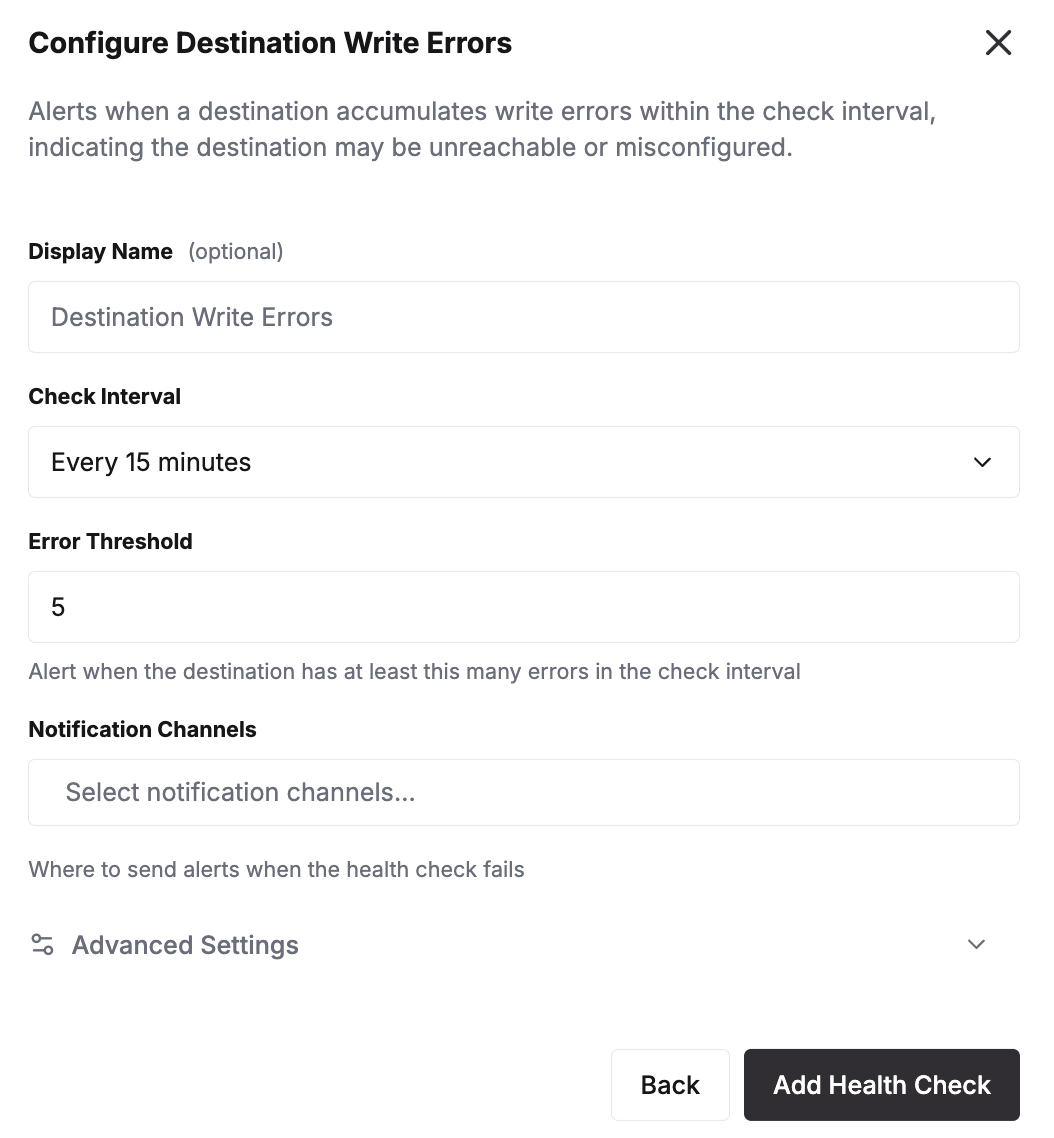
- Display Name (optional): Label in the check list and in the alert body. The field placeholder is Destination Write Errors. Leave it blank and the list shows that name. The alert body then uses the destination's name instead. The alert title always uses the destination's display name.
- Check Interval: How often the check runs, and the length of the error-count window. The menu offers Every 5 minutes, Every 15 minutes, Every 30 minutes, Every hour, Every 6 hours, Every 12 hours, and Every 24 hours. The dialog opens on Every 15 minutes.
- Error Threshold: "Alert when the destination has at least this many errors in the check interval." The dialog opens on 5. The value must be at least 1.
- Notification Channels: "Where to send alerts when the health check fails." The empty field reads Select notification channels.... With none selected, the check still runs and records status.
- Consecutive Failures, under Advanced Settings: "Consecutive failed checks before alerting." Failed evaluations in a row required before the status becomes Alerting and a notification is sent. Default: 1. Minimum: 1.
- Throttle (min), under Advanced Settings: "Minutes between repeat alerts (default 30)." Minutes to wait before sending another alert while the check stays alerting. The field placeholder is 30. Set this to 0 to send an alert on every evaluation while it is still alerting.
A shorter Check Interval notices a run of failures sooner. It also counts a shorter window, so the same Error Threshold is easier to reach and alerts can arrive more often. A longer interval, a higher threshold, a higher Consecutive Failures value, or a larger Throttle (min) waits longer and sends fewer alerts.
Suggested settings
These combinations use only the interval menu and the numeric fields on the dialog.
| Situation | Check Interval | Error Threshold | Consecutive Failures | Throttle (min) |
|---|---|---|---|---|
| High-volume production destination | Every 5 minutes | 5 | 1 | 30 |
| Lower-volume destination | Every hour | 1 | 1 | 30 |
| Noisy or less critical destination | Every 15 minutes | 5 | 3 | 30 |
- High-volume production: five failed writes inside five minutes alerts on the first breach, then repeats every 30 minutes. Use this for a ClickHouse destination that receives a steady stream.
- Lower-volume: one recorded failure during the past hour is enough to alert. A threshold of 5 in a short window can stay quiet on a destination that only writes occasionally, such as an object-storage archive.
- Noisy or less critical: the check still evaluates every 15 minutes, and it alerts after three failed evaluations in a row (about 45 minutes). Repeats stay 30 minutes apart. Every 6 hours, Every 12 hours, and Every 24 hours are the other ways to widen the window when a destination can wait.
Status
The check list shows one of these statuses:
| Status | What you see |
|---|---|
| Healthy | The latest evaluation was under the error threshold |
| Pending | The evaluation failed, and consecutive failures have not yet reached Consecutive Failures |
| Alerting | Consecutive failures reached the threshold, so RunReveal sends notifications |
The same table shows First Alerted (a relative time while the check is Pending or Alerting), Consecutive Failures / Failure Threshold, and Last Alert Sent.
Select a row to open that check's history. The time range defaults to the last 24 hours. The panel shows:
- A bar of status pills from older runs to now
- Latest Errors (the newest run's error count), Avg. Errors, Healthy (%) (the share of runs in the range that were healthy), and Total Checks
- An error-count chart
- Status Change History for recent status transitions in that range, including the message for that transition
A run that cannot count errors is marked Error on that history. That run leaves the check's Healthy, Pending, or Alerting status unchanged, and it does not send an alert on its own.
Alerts
The alert title is RunReveal Destination Health Check Alert: followed by the destination's display name. The message includes the health check name, destination name, destination type, error count and threshold, how long the check has been alerting, consecutive failures, and a link to that destination. The link uses the app host for your workspace: app.runreveal.com or app.runreveal.clickhouse.cloud.
Repeat alerts follow Throttle. While a check is silenced it keeps evaluating and recording status, and notifications wait until the silence ends. Durations are 1 hour, 4 hours, 8 hours, 1 day, 3 days, 1 week, 2 weeks, 1 month, or a custom time. Silence is available once the check has a notification channel. A silenced check shows a silence badge beside its name.
Deleting a destination deletes its health checks. Deleting a check cannot be undone.
Troubleshoot a failing destination
- Open the check and read Latest Errors, the chart, and Status Change History.
- Open Destination Errors and filter by destination type or name. The page charts errors over the selected range (default: the last 24 hours) and lists each failure as a timestamp, destination type, destination name, and the error text.
- On a ClickHouse destination you host yourself, Test Connection is on the read connection and again on the write connection. ClickHouse Cloud has Test Connection for the query connection, and the storage panel on its row is another live connection check. S3, R2, and GCS use Verify Bucket Configuration.
- Confirm the destination is still enabled, and that a pipeline Destination step still routes events to it. Errors are recorded when RunReveal tries to open the destination or write a batch. A disabled destination, or one that no pipeline sends events to, can stay Healthy because no new write is being attempted.
- Pending means the check has seen failures and is waiting on Consecutive Failures before it alerts. Healthy means the errors in the latest interval were under the threshold. Use source health checks to watch whether logs are still arriving from a source.
- If the status is Alerting and no message arrived, confirm a notification channel is selected, the check is not silenced, and Throttle has not delayed the next alert. Sent alerts are listed under Notifications → History.
If the error text is not enough to fix the destination, contact us with the destination name, the check status, and the line from Destination Errors.
Related Documentation
- Pipelines - Topics, step order, and preconditions
- Set TTL - Retention step for ClickHouse
- Source Health Checks - Monitor log ingest volume
FAQ
Can I send the same event to more than one destination?
Yes. Add multiple Destination steps in the same pipeline. Each step appends a destination ID, so the event is routed to all selected outputs.
If I route to RunReveal Backend, does that also send to S3?
No. RunReveal Backend only targets ClickHouse storage. To send to S3, R2, or GCS, add a Destination step that selects that object storage destination.
If I configure a destination in the Destinations UI, do events go there automatically?
No. Creating a destination only makes it available for routing. Events are sent to a destination only when a pipeline includes a matching Destination step.
What happens if a pipeline has no Destination step?
For older pipelines, the router can still fall back to RunReveal Backend when no destination attributes are present. Use explicit Destination steps so routing is predictable.
Does one destination failure block all other destinations?
No. Routing attempts continue for other destinations, and errors are collected together. A failure in one destination does not stop delivery attempts to the rest.
How do I know a destination is failing?
Add a Destination Write Errors check on that destination, then open Destinations → Destination Errors to read the failure text. See Health Checks.
Can I build an S3-only pipeline?
Yes. Add only the S3 destination step and do not include RunReveal Backend in that pipeline.
If I use a Destination step for another destination only, do events still go to RunReveal Backend?
No. If your pipeline only points to another destination, events only go there. They only go to RunReveal Backend if you add a Destination step for it, or in older fallback behavior when no destination attributes are set.