Explore Logs
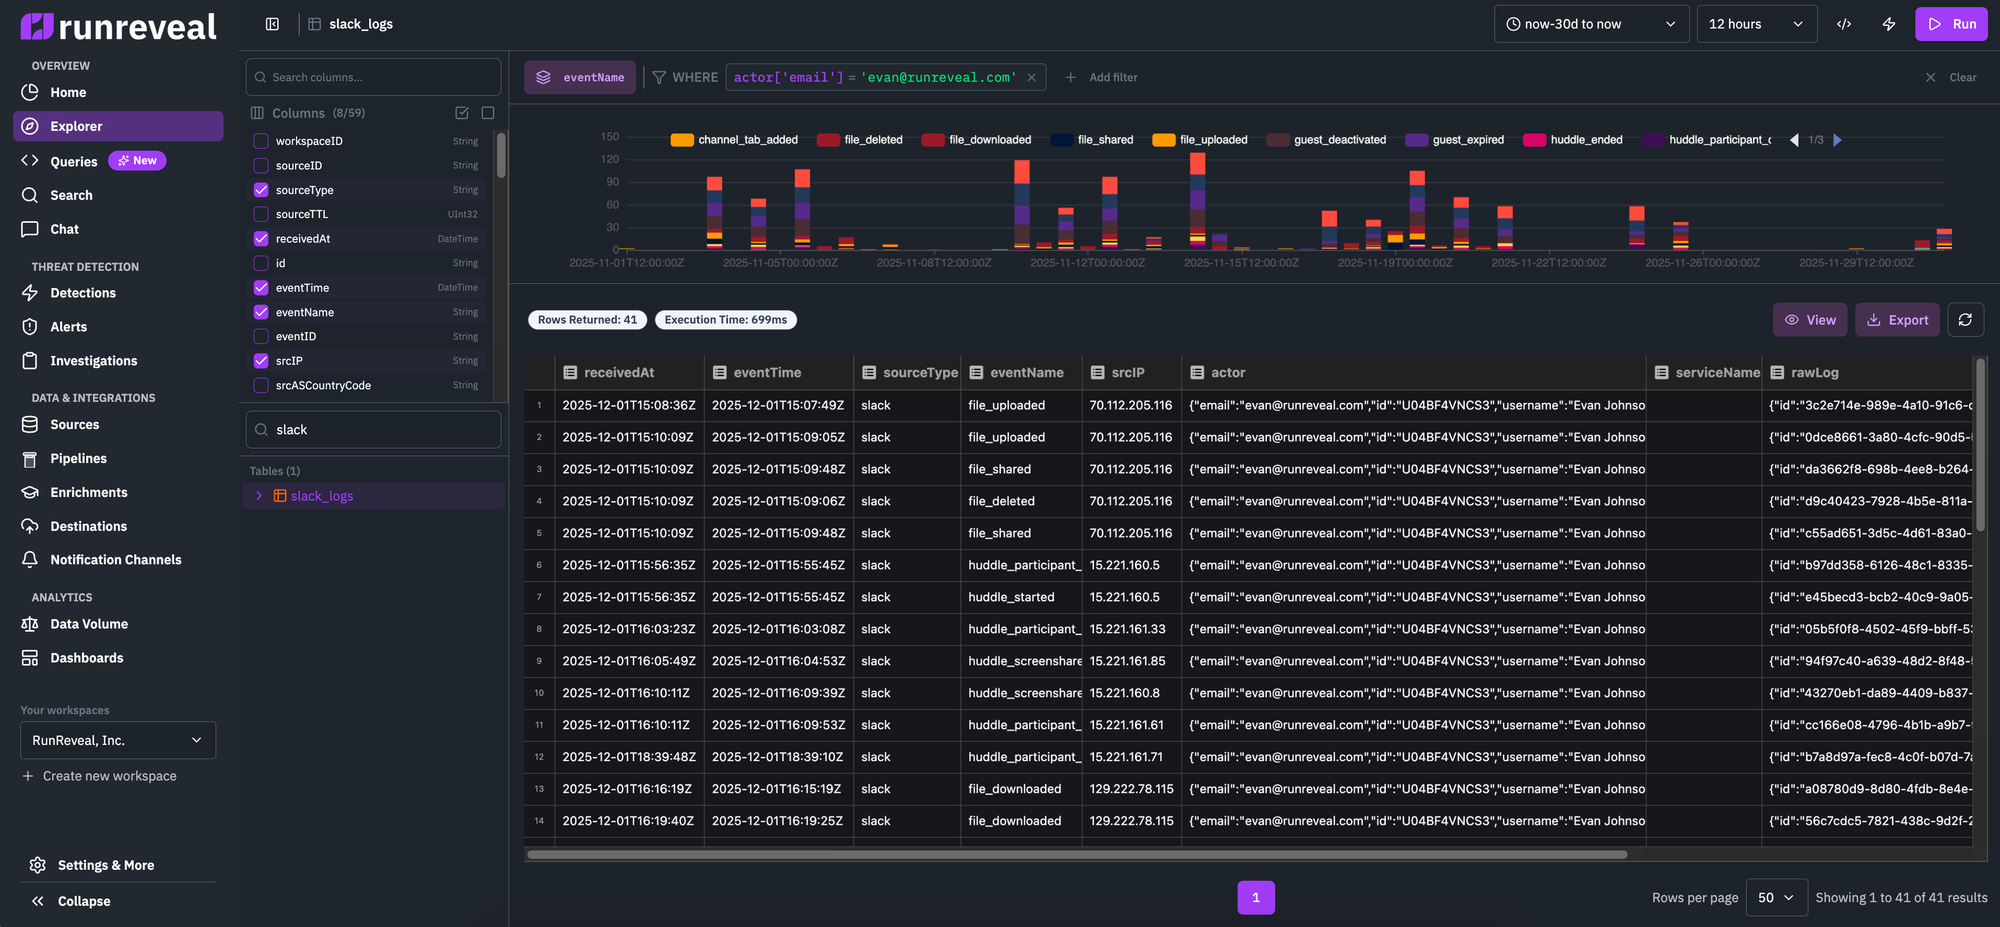
RunReveal's log explorer provides a powerful interface for querying and analyzing your log data. The explorer features a compact layout, sidebar navigation, saved queries with version history, and AI-powered query assistance.
Overview
RunReveal's log explorer provides an improved experience for log analysis with better visibility, intuitive filtering, and AI-powered query assistance. The explorer makes all functionality discoverable and accessible on a single page.
Key Features
The log explorer includes several key features:
- Compact Layout: Everything fits on one page - you can see log volume, filters, and results simultaneously without constant scrolling
- Sidebar Navigation: Table and column selection in a dedicated sidebar for better discoverability
- Linkable Views: Share exploration sessions with shareable URLs that preserve your exact configuration
- Saved Queries: Save queries with version history to iterate on ideas and track changes over time
- AI Assistant: Get help creating and updating queries using natural language prompts
- Fixed Layout: Optimized screen real estate with fixed-size components for consistent viewing
Explorer Interface Layout
The explorer is organized into these key sections:
1. Sidebar (Left)
The collapsible sidebar provides:
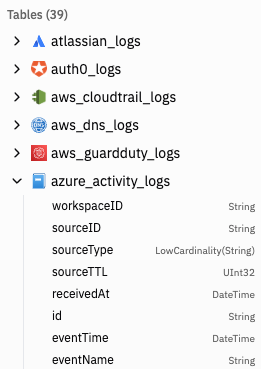
- Table Browser: Browse and select from available tables, views, and materialized views
- Tables are organized by category (logs, source-specific views, custom views)
- Expand tables to see their schema and available columns
- Click a table to select it for querying
- Column Selection: When a table is selected, view all available columns with their data types
- Toggle Button: Collapse/expand the sidebar to maximize screen space
Source log tables
Source log tables hold normalized security events from your integrations (Okta, AWS CloudTrail, GitHub, endpoint agents, and so on). After ingest and pipeline processing, each event is stored with a common schema plus optional source-specific columns. These are the tables you use for threat hunting, dashboards, and most detection authoring.
How tables are organized in Explore
| What you see | What it is |
|---|---|
logs | Single table with all events from every enabled source in the workspace. Filter with sourceType and sourceID when you need to narrow scope. Always available. |
| Source-specific tables or views | One table (or view) per integration family—for example okta_logs, aws_cloudtrail_logs, github_logs, gcp_logs. Shown in the sidebar when you have at least one source of that type configured. Optimized for that source’s primary key and common filters. |
| Unused source tables | Tables for source types you have not configured yet. Listed separately in the sidebar so you can see what becomes available when you add a source. |
| Custom views | Virtual tables you define (Settings → Custom Views). They read from logs and expose extra columns extracted from rawLog via JSON paths. |
Naming is usually {integration}_logs (for example circleci_audit_logs, sentinelone_threat_logs). The exact table for each source type is documented on that source’s page under Sources.
What each row contains
Every ingested event is a row. Pipelines normalize vendor logs into shared fields where possible; the full vendor payload is always retained in rawLog for JSON extraction or debugging.
| Column | Description |
|---|---|
id | RunReveal event ID |
workspaceID, sourceID, sourceType | Workspace and source instance (use sourceType when querying logs) |
receivedAt | When RunReveal ingested the event—use this for time filtering in Explore and detections |
eventTime | When the activity occurred according to the upstream system |
eventName, eventID | Normalized event name and upstream event ID |
actor | Map of actor attributes (user email, principal ID, and so on) |
srcIP, dstIP | Source and destination IPs, with GeoIP/AS fields where enriched |
resources | Related resource identifiers |
serviceName, readOnly, tags | Service context, mutability hint, and key-value tags |
rawLog | Original JSON (or text) from the source—use JSONExtract* for fields not promoted to columns |
| (source-specific) | Additional columns on some tables (for example CloudTrail userIdentity.* on aws_cloudtrail_logs) |
Query performance: Prefer a source-specific table when you know the integration (for example okta_logs instead of logs with sourceType = 'okta'). When using logs, put sourceType and receivedAt in WHERE first. See Query tips and SQL Queries.
Platform tables (non–log-source data)
Explore also exposes platform tables for detection results, operational metrics, errors, and audit data—separate from the source log tables above.
In the sidebar they appear under System tables or in the general table list. Use the tabs below for what each table contains and which columns to query. Example queries for detections, signals, and alerts are in Detections, Signals, and Alerts.
Table · filter on receivedAt (also createdAt, eventTime)
Base table for every detection query run. Each row is one row returned by a detection (SQL or Sigma). Use this when you need all findings regardless of notification configuration.
| Column | Type | Description |
|---|---|---|
id | String | Unique ID for this detection result row |
scheduledRunID | String | ID of the scheduled detection run |
workspaceID | String | Workspace identifier |
detectionID | String | Detection rule ID |
detectionName | String | Human-readable detection name |
detectionType | String | sql or sigma (and other low-cardinality types) |
recordsReturned | Int32 | Rows returned by the detection query |
runTime | Int64 | Query runtime in nanoseconds |
query | String | SQL executed for this run |
params | Map(String, String) | Parameters passed to the query |
columnNames | Array(String) | Result column names |
columnTypes | Array(String) | Result column types |
results | String | JSON array of sample result rows (up to 100) |
riskScore | Int32 | Risk score (0–100) |
severity | String | low, medium, high, critical |
actor | Map(String, String) | Actor fields (for example email, username) |
resources | Array(String) | Resource identifiers from the finding |
srcIP | String | Source IP from the underlying events |
dstIP | String | Destination IP from the underlying events |
categories | Array(String) | Detection category tags |
mitreAttacks | Array(String) | MITRE ATT&CK technique IDs |
notificationNames | Array(String) | Notification channels that fired (empty if none) |
error | String | Query error message, if the run failed |
createdAt | DateTime | When the detection query ran |
eventTime | DateTime | Timestamp of the underlying security event |
receivedAt | DateTime | When RunReveal received the related event |
Time filtering: Log tables default to receivedAt in the time picker. Each platform table tab lists its primary time column—use that column in WHERE when the picker does not apply (for example executionTime on scheduled_query_runs or minute on runreveal_source_volumes).
Some internal tables (for example handler_errors, usage_events) are not shown in the Explore sidebar but may exist in the database; prefer the tables above for analysis.
2. Top Bar
The top bar contains:
- Time Picker: Select your time range for the query
- Interval Selector: Set the time bucket granularity for the histogram
- Action Buttons:
- "Edit as Query": Switch to SQL mode and open the query in the query editor
- "Create Detection": Convert your exploration into a detection rule
- Share/Link: Generate a shareable link to your current exploration state
3. Filter Builder
The filter section allows you to:
- Build Dynamic Filters: Add filters using a visual builder with column autocomplete
- Type-Aware Operators: Operators adapt based on column data type (equals, contains, greater than, etc.)
- Multiple Conditions: Add multiple filters that combine with AND logic
- Context Menu: Right-click on result values to quickly "Include in filter" or "Exclude from filter"
4. Visualization
The time-series histogram:
- Fixed Size: Compact, horizontally-stretched chart that doesn't dominate the page
- Click to Zoom: Click and drag on the chart to select a time range and automatically update filters
- Grouped Series: When grouping by a column, see multiple colored series for comparison
- Real-time Updates: Chart updates automatically as you modify filters or time ranges
5. Results Table
The results view:
- Fixed Space: Dedicated area for log results with proper scrolling
- Sortable Columns: Click column headers to sort results
- Row Details: Click rows to see full event details
- Performance Metrics: Shows query execution time and row count
SQL Query Mode
When you click "Edit as Query", the explorer switches to SQL mode:
- SQL Editor: Full-featured SQL editor with syntax highlighting
- Same Layout: Maintains the same page layout for consistency
- Saved Queries Sidebar: Access your saved queries from a collapsible drawer
- Version History: View and restore previous versions of saved queries
- AI Assistant: Get help writing and fixing SQL queries using natural language
Saved Queries
The explorer includes a powerful saved queries system:
Creating Saved Queries
- Write your query in SQL mode
- Click "Save" in the top bar
- Enter a name and optional description
- The query is saved with all parameters and settings
Version History
Every time you save a query, a new version is created:
- View History: Click the version history icon to see all previous versions
- Restore Versions: Restore any previous version of a query
- Track Changes: See when each version was created and by whom
- Automatic Versioning: No need to manually version - every save creates a new version
Managing Saved Queries
- Saved Queries Drawer: Access all your saved queries from the sidebar
- Search: Search saved queries by name
- Duplicate: Create a copy of a saved query to iterate on
- Delete: Remove saved queries you no longer need
- Edit Name: Click the query name in the header to edit it inline (Google Docs-style)
AI Assistant
The AI assistant helps you work with queries:
Using AI to Create Queries
- Click the AI Assistant button in SQL mode
- Describe what you want to query in natural language
- The AI generates a SQL query based on your description
- Review and refine the generated query
Fixing Query Errors
When a query has an error:
- Click "Fix with AI" button
- The AI analyzes the error and suggests a fix
- Review the corrected query and apply it
Query Iteration
- Refine Queries: Ask the AI to modify existing queries
- Add Filters: Request additional filters or conditions
- Optimize: Ask for query optimization suggestions
Linkable Exploration Views
Every exploration state can be shared via URL:
- Shareable Links: The URL contains all your settings (table, filters, time range)
- Team Collaboration: Share investigation links with team members
- Documentation: Bookmark specific exploration states for documentation
- Context Preservation: Links preserve your exact filter configuration
Switching Between Modes
You can seamlessly switch between exploration modes:
- Explorer → Query Editor: Click "Edit as Query" to convert your exploration to SQL
- Query Editor → Explorer: Use the "Open in Explorer" option to view query results in explorer mode
- State Preservation: Your filters and settings are preserved when switching modes
Best Practices
- Start with Explorer: Use the visual explorer for initial investigation
- Switch to SQL: Use "Edit as Query" when you need more complex queries
- Save Frequently: Save queries as you iterate to preserve your work
- Use Version History: Don't worry about breaking queries - you can always restore
- Share Links: Use shareable links to collaborate with your team
- Leverage AI: Use the AI assistant for query suggestions and error fixes
Query Tips
Follow these tips to improve query performance and get faster results:
-
Use source-specific views: Instead of querying the
logstable, use source-specific views likeokta_logs,aws_cloudtrail_logs, orgithub_logs. These views are optimized for their respective sources and can significantly improve query speed. -
Filter by sourceType: When querying the
logstable, add a filter onsourceTypeto narrow down results to specific log sources. This reduces the amount of data that needs to be scanned. -
Use smaller time ranges: Shorter time windows (e.g., 1 hour or 1 day) process faster than longer ranges (e.g., 30 days). Start with a smaller time range to test your query, then expand if needed.
-
Add specific filters early: Apply filters on indexed fields (like
sourceType,sourceID, or normalized fields) as early as possible in your query to reduce the dataset size before processing. -
Limit result sets: Use the LIMIT clause or set reasonable result limits to avoid processing and returning excessive amounts of data.
-
Use aggregations: When possible, use aggregation functions (COUNT, SUM, etc.) instead of returning all individual events. Aggregations are more efficient for large datasets.
-
Filter on
receivedAt: The time picker in Explore applies toreceivedAt(when RunReveal received the event). See Timestamps and clock synchronization below and SQL Queries for when to useeventTime.
Timestamps and clock synchronization
RunReveal stores two timestamps on every normalized event:
| Field | Meaning |
|---|---|
eventTime | When the activity occurred, taken from the source log (unchanged) |
receivedAt | When RunReveal ingested the event (UTC, set on ingest infrastructure) |
Explore and detections should filter on receivedAt by default. It is indexed, consistent across sources, and reflects when data entered RunReveal. Use eventTime when you need the original time from the upstream system (for example, correlating with another tool that uses the source’s clock).
RunReveal infrastructure
Ingest and processing hosts use standard Linux time synchronization (NTP via the distribution default, such as chrony or systemd-timesyncd) against public authoritative time sources. The receivedAt field reflects that synchronized ingest clock.
Source systems
eventTime is preserved as provided by each integration. RunReveal does not modify or realign source timestamps. Accurate eventTime across Okta, AWS, endpoints, and other tools depends on time synchronization (typically NTP) on those source systems.
For full guidance on receivedAt vs eventTime, indexing, and query patterns, see SQL Queries — Timestamp fields.
Related Documentation
- Pipelines - Build and manage data processing pipelines
- Transforms - Normalize and transform your log data
- Custom Views - Create virtual tables with custom columns
- Filtering - Apply filters to focus on specific events
- Detections - Create automated detection rules from your queries
- Dashboards - Visualize your log data with custom dashboards
- SQL Queries - Timestamp fields, parameters, and optimization