PagerDuty
Collect audit logs and events from your PagerDuty account to monitor administrative changes and user activities. You'll find these logs in the pagerduty_logs table(s).

Setup
This source uses polling to collect audit records every 60 seconds. The PagerDuty source polls audit records to collect administrative changes and user activities, including:
- Account management
- Service changes
- Incident management
- User access patterns
Logs should begin populating within a minute after being added.
API Token
To connect your PagerDuty account, you'll need to provide a PagerDuty API token. This token is used to authenticate and access your PagerDuty audit logs.
- Log into your PagerDuty account
- Navigate to your account settings
- Generate a new API token with appropriate permissions for audit log access
- Copy the token and paste it into the "PagerDuty API Token" field when creating your source
API Endpoint
RunReveal uses the PagerDuty Audit Records API to collect audit logs. This endpoint provides comprehensive audit records of administrative changes and user activities within your PagerDuty account.
The API endpoint used is:
This endpoint returns audit records that include:
- User authentication events
- Account configuration changes
- Service modifications
- Incident management activities
- User access and permission changes
- Integration updates
- Team and escalation policy changes
Source Configuration
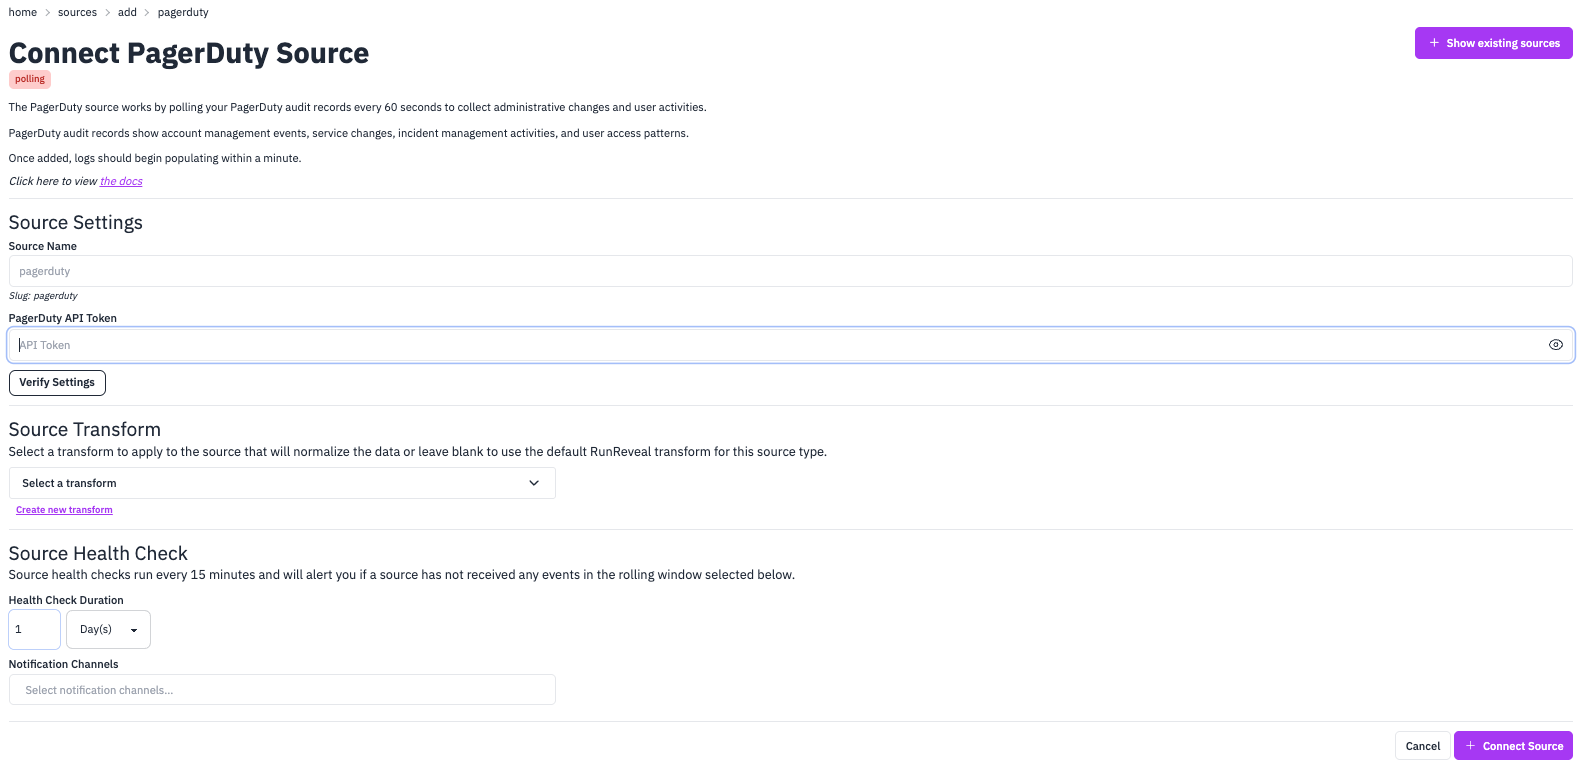
When setting up your PagerDuty source, you'll need to provide:
- Source Name: A descriptive name for your PagerDuty source (defaults to "pagerduty")
- PagerDuty API Token: Your PagerDuty API token for authentication
- Health Check Duration: Configure how often to check source health (default: 1 day)
- Notification Channels: Set up alerts for when the source stops receiving events
Verification
After entering your API token, use the "Verify Settings" button to test the connection and ensure your token has the correct permissions to access PagerDuty audit logs.
Log Format Example
Here's an example of a single PagerDuty audit log record:
This example shows a team creation audit event with all the key fields including execution context, actors, method, and details.
Verify It's Working
Once added the source logs should begin flowing within a minute.
You can validate we are receiving your logs by running the following SQL query.
Schema
The following columns are exposed for this source. RunReveal applies schema normalization across all sources, ensuring uniform field names and data types for cross-source queries and reusable detection logic.
Table: pagerduty_logs (57 columns)
pagerduty_logs (57 columns)| Column | Type |
|---|---|
workspaceID | String |
sourceID | String |
sourceType | LowCardinality(String) |
sourceTTL | UInt32 |
receivedAt | DateTime |
id | String |
eventTime | DateTime |
eventName | String |
eventID | String |
srcIP | String |
srcASCountryCode | String |
srcASNumber | UInt32 |
srcASOrganization | String |
srcCity | String |
srcConnectionType | String |
srcISP | String |
srcLatitude | Float64 |
srcLongitude | Float64 |
srcUserType | String |
dstIP | String |
dstASCountryCode | String |
dstASNumber | UInt32 |
dstASOrganization | String |
dstCity | String |
dstConnectionType | String |
dstISP | String |
dstLatitude | Float64 |
dstLongitude | Float64 |
dstUserType | String |
| Column | Type |
|---|---|
actor | Map(String, String) |
tags | Map(String, String) |
resources | Array(String) |
serviceName | String |
readOnly | Bool |
rawLog | String |
audit_id | String |
self | String |
execution_time | DateTime |
execution_context_request_id | String |
execution_context_remote_address | String |
actors | Array(String) |
method_description | String |
method_truncated_token | String |
method_type | String |
root_resource_id | String |
root_resource_summary | String |
root_resource_type | String |
root_resource_self | String |
root_resource_html_url | String |
action | String |
details_resource_id | String |
details_resource_summary | String |
details_resource_type | String |
details_resource_self | String |
details_resource_html_url | String |
details_fields | Array(String) |
details_references | Array(String) |