Quick Start Guide: Detections, Signals, and Alerts
This guide walks you through RunReveal's detection system using hands-on examples. We will go over adding a webhook to send test logs to via curl to test detections and see how Detections, Signals, and Alerts work together.
Detections, Signals, and Alerts are all classified as detection results and are part of the Detections table. Signals are detection results without notifications (for analysis/tuning). Alerts are detection results that trigger notifications.
| Detections | Signals | Alerts | |
|---|---|---|---|
| What it is | Automated rules that analyze logs | Detection results without notifications | Detection results with notifications |
| Purpose | Continuous monitoring and analysis | Pattern recognition and tuning | Immediate awareness and response |
| Filtering | detections table | signals table | alerts table |
| Notifications | None | None | Email, Slack, PagerDuty, etc. |
| Use Case | Security policy enforcement | Threat hunting and analysis | Incident response workflows |
Getting Started
This guide walks you through the complete workflow for setting up detections, signals, and alerts in RunReveal:
- Create Webhook Source - Set up a data source to receive test events (Either a Structured Webhook or Generic Webhook Source in UI)
- Send Test Data - Generate sample security events for testing
- Create Detection Rule - Build a SQL-based detection that analyzes your data
- Trigger and Review - Manually run the detection and check results
- Compare Signal vs Alert - Convert to alerts and see the difference
For some pointers on how to write detections, please see our dedicated page.
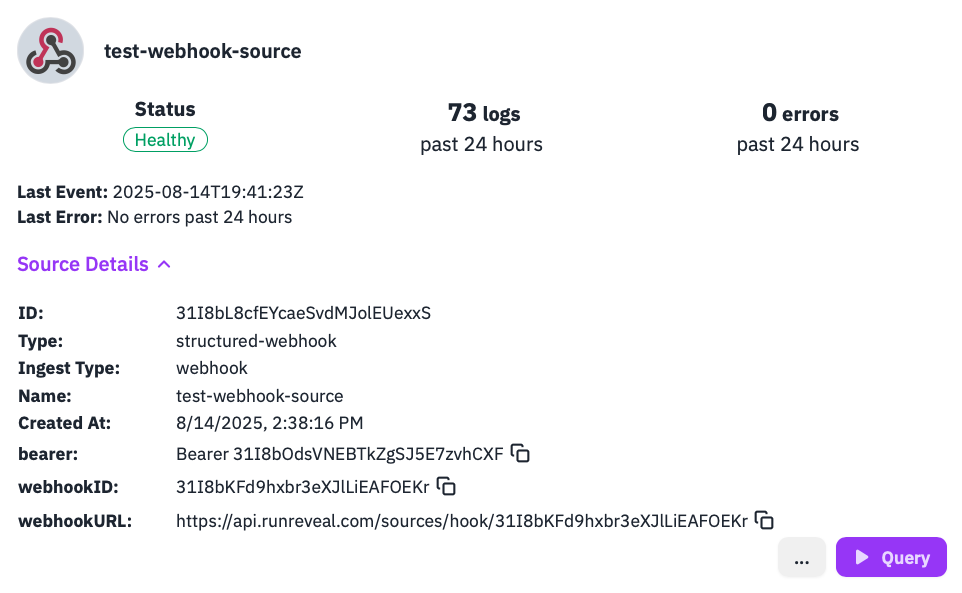
Step 1: Create Webhook Source
First, create a webhook source in RunReveal to receive test data:
- In RunReveal UI:
- Navigate to Sources in the left sidebar
- Click Connect a new source
- Select Webhook from the source types
- Configure the webhook:
- Name:
test-webhook-source - Description:
Test webhook for detection guide
- Name:
- Click Create or Save
- Copy the webhook URL - it will look like:
https://api.runreveal.com/sources/hook/YOUR_WEBHOOK_ID - You'll also need to copy the bearer token and pass it in the Authorization header with your webhook's request. Alternatively, after saving the webhook source, you can edit it and remove the bearer token to allow unauthenticated requests for this webhook.
Step 2: Send Test Data
Now send a test security event using your webhook URL:
-
Test Event:
-
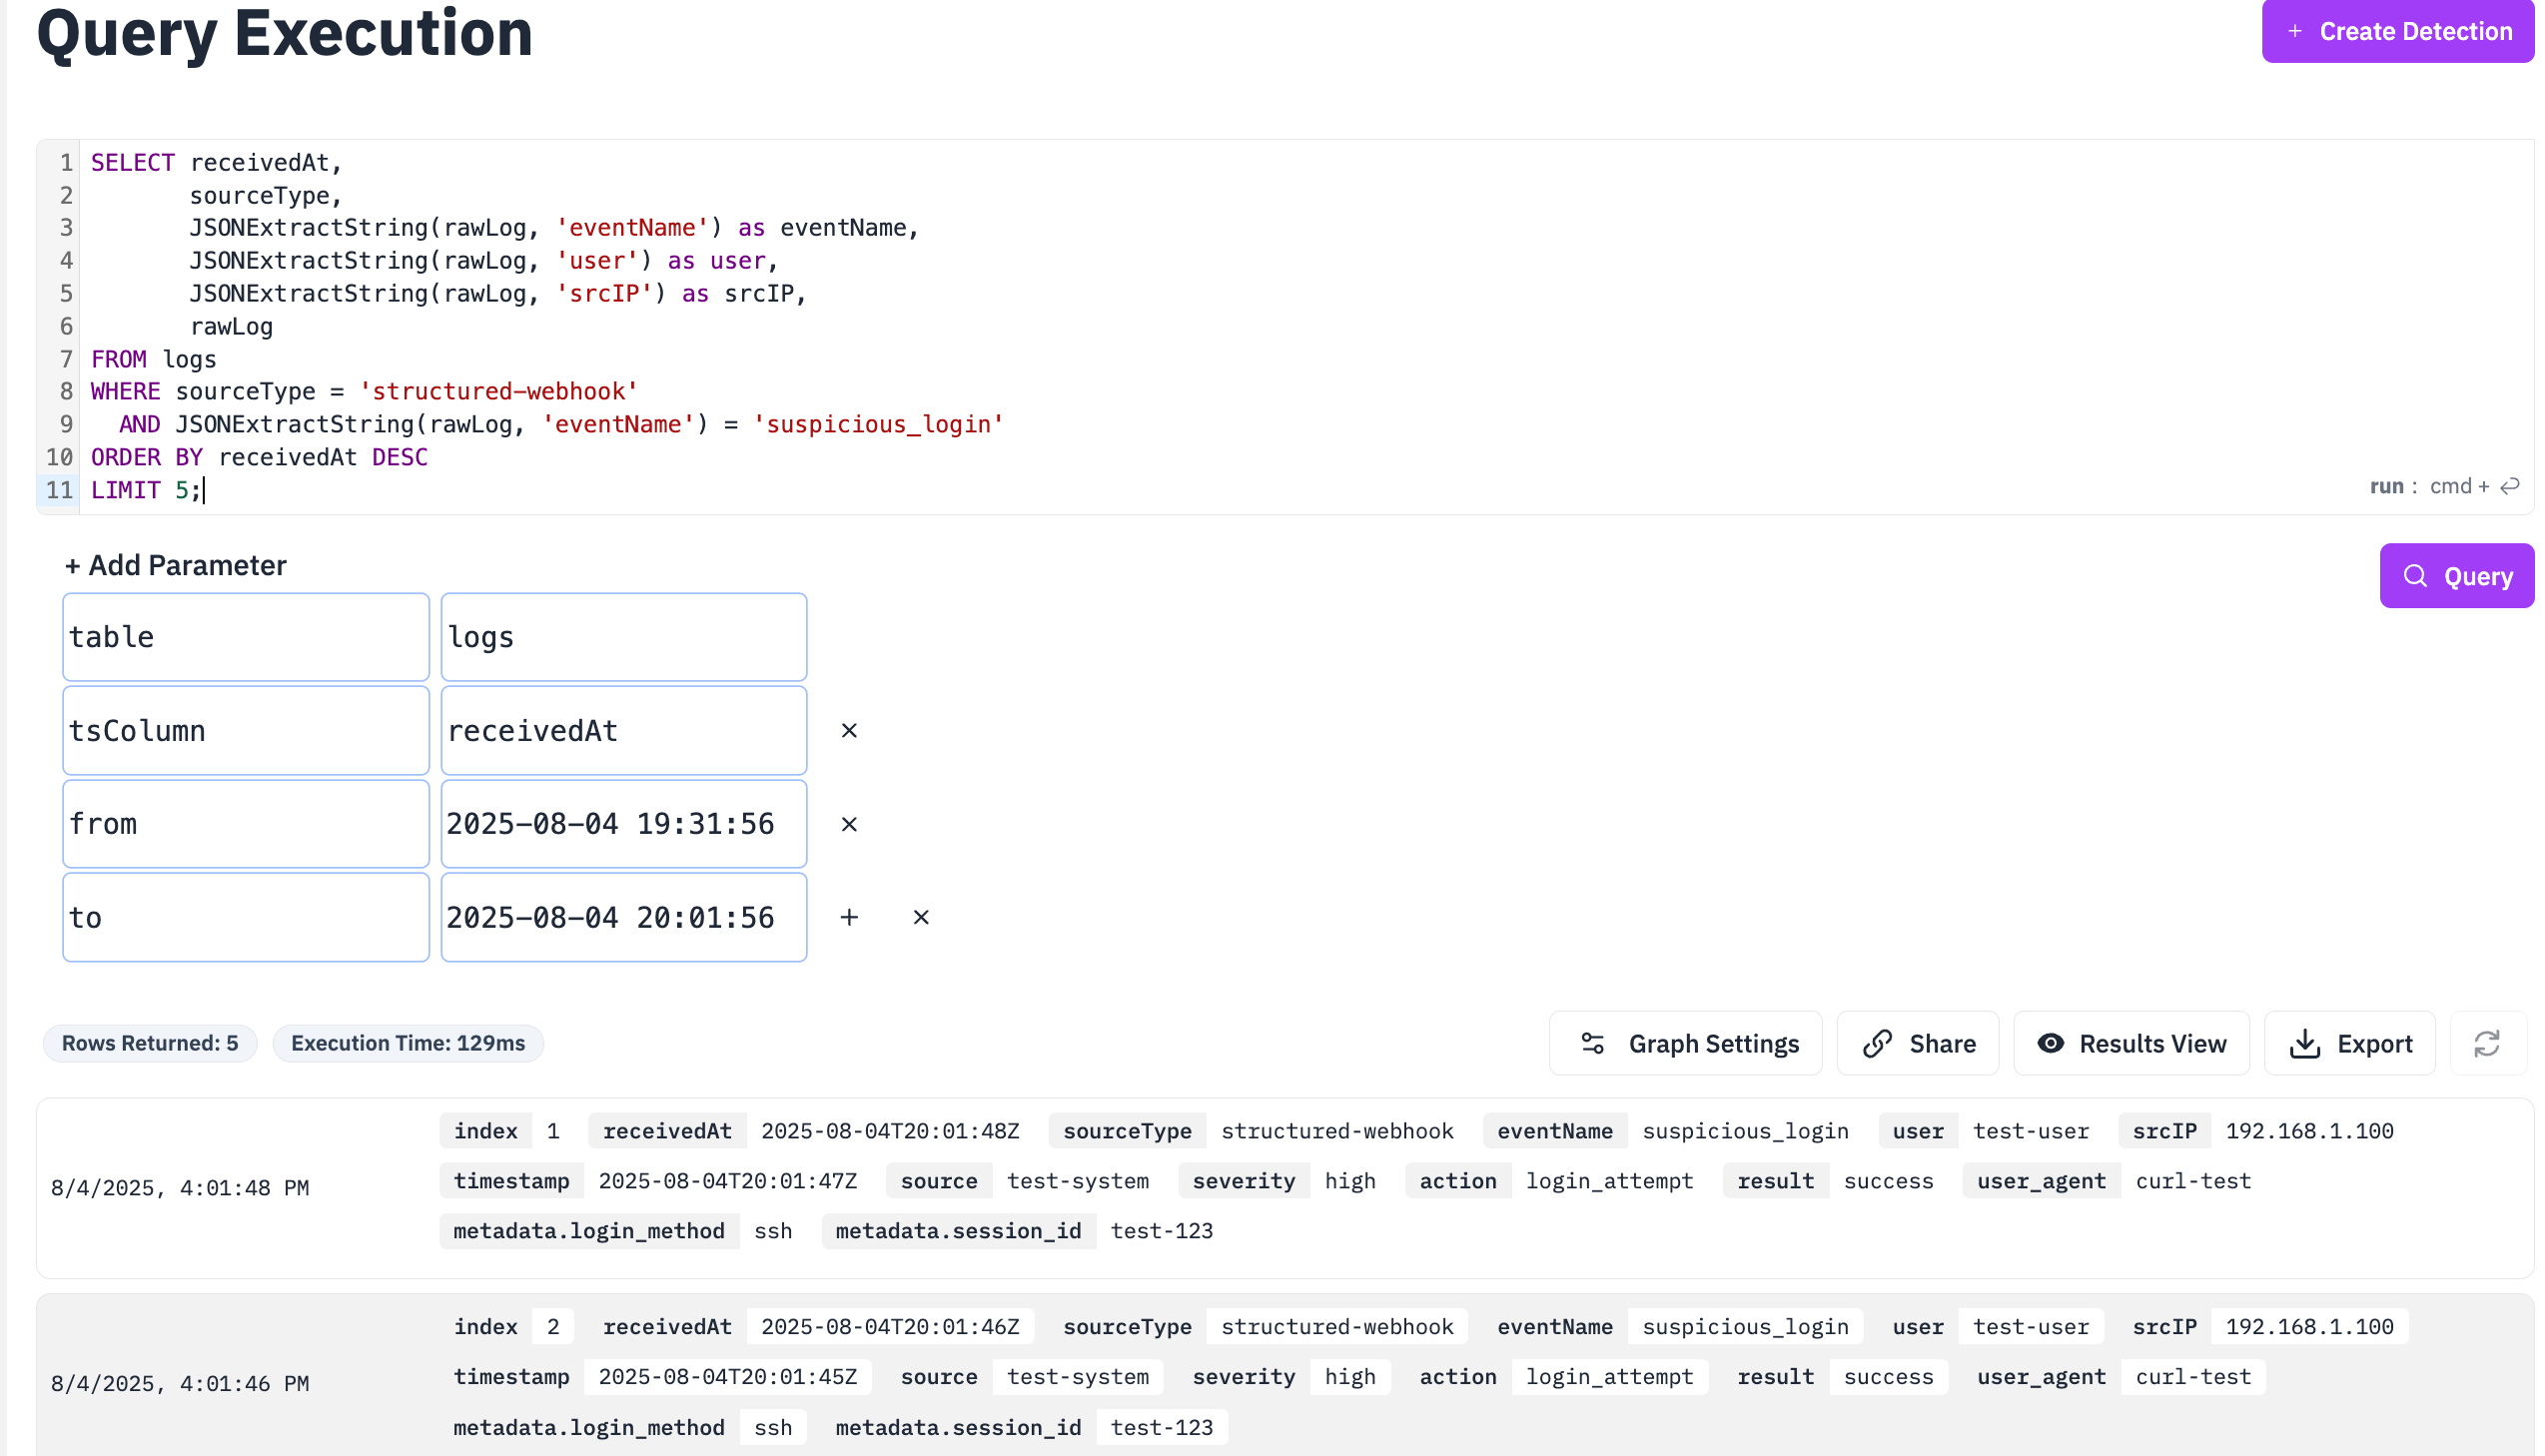
Verify ingestion to logs table:
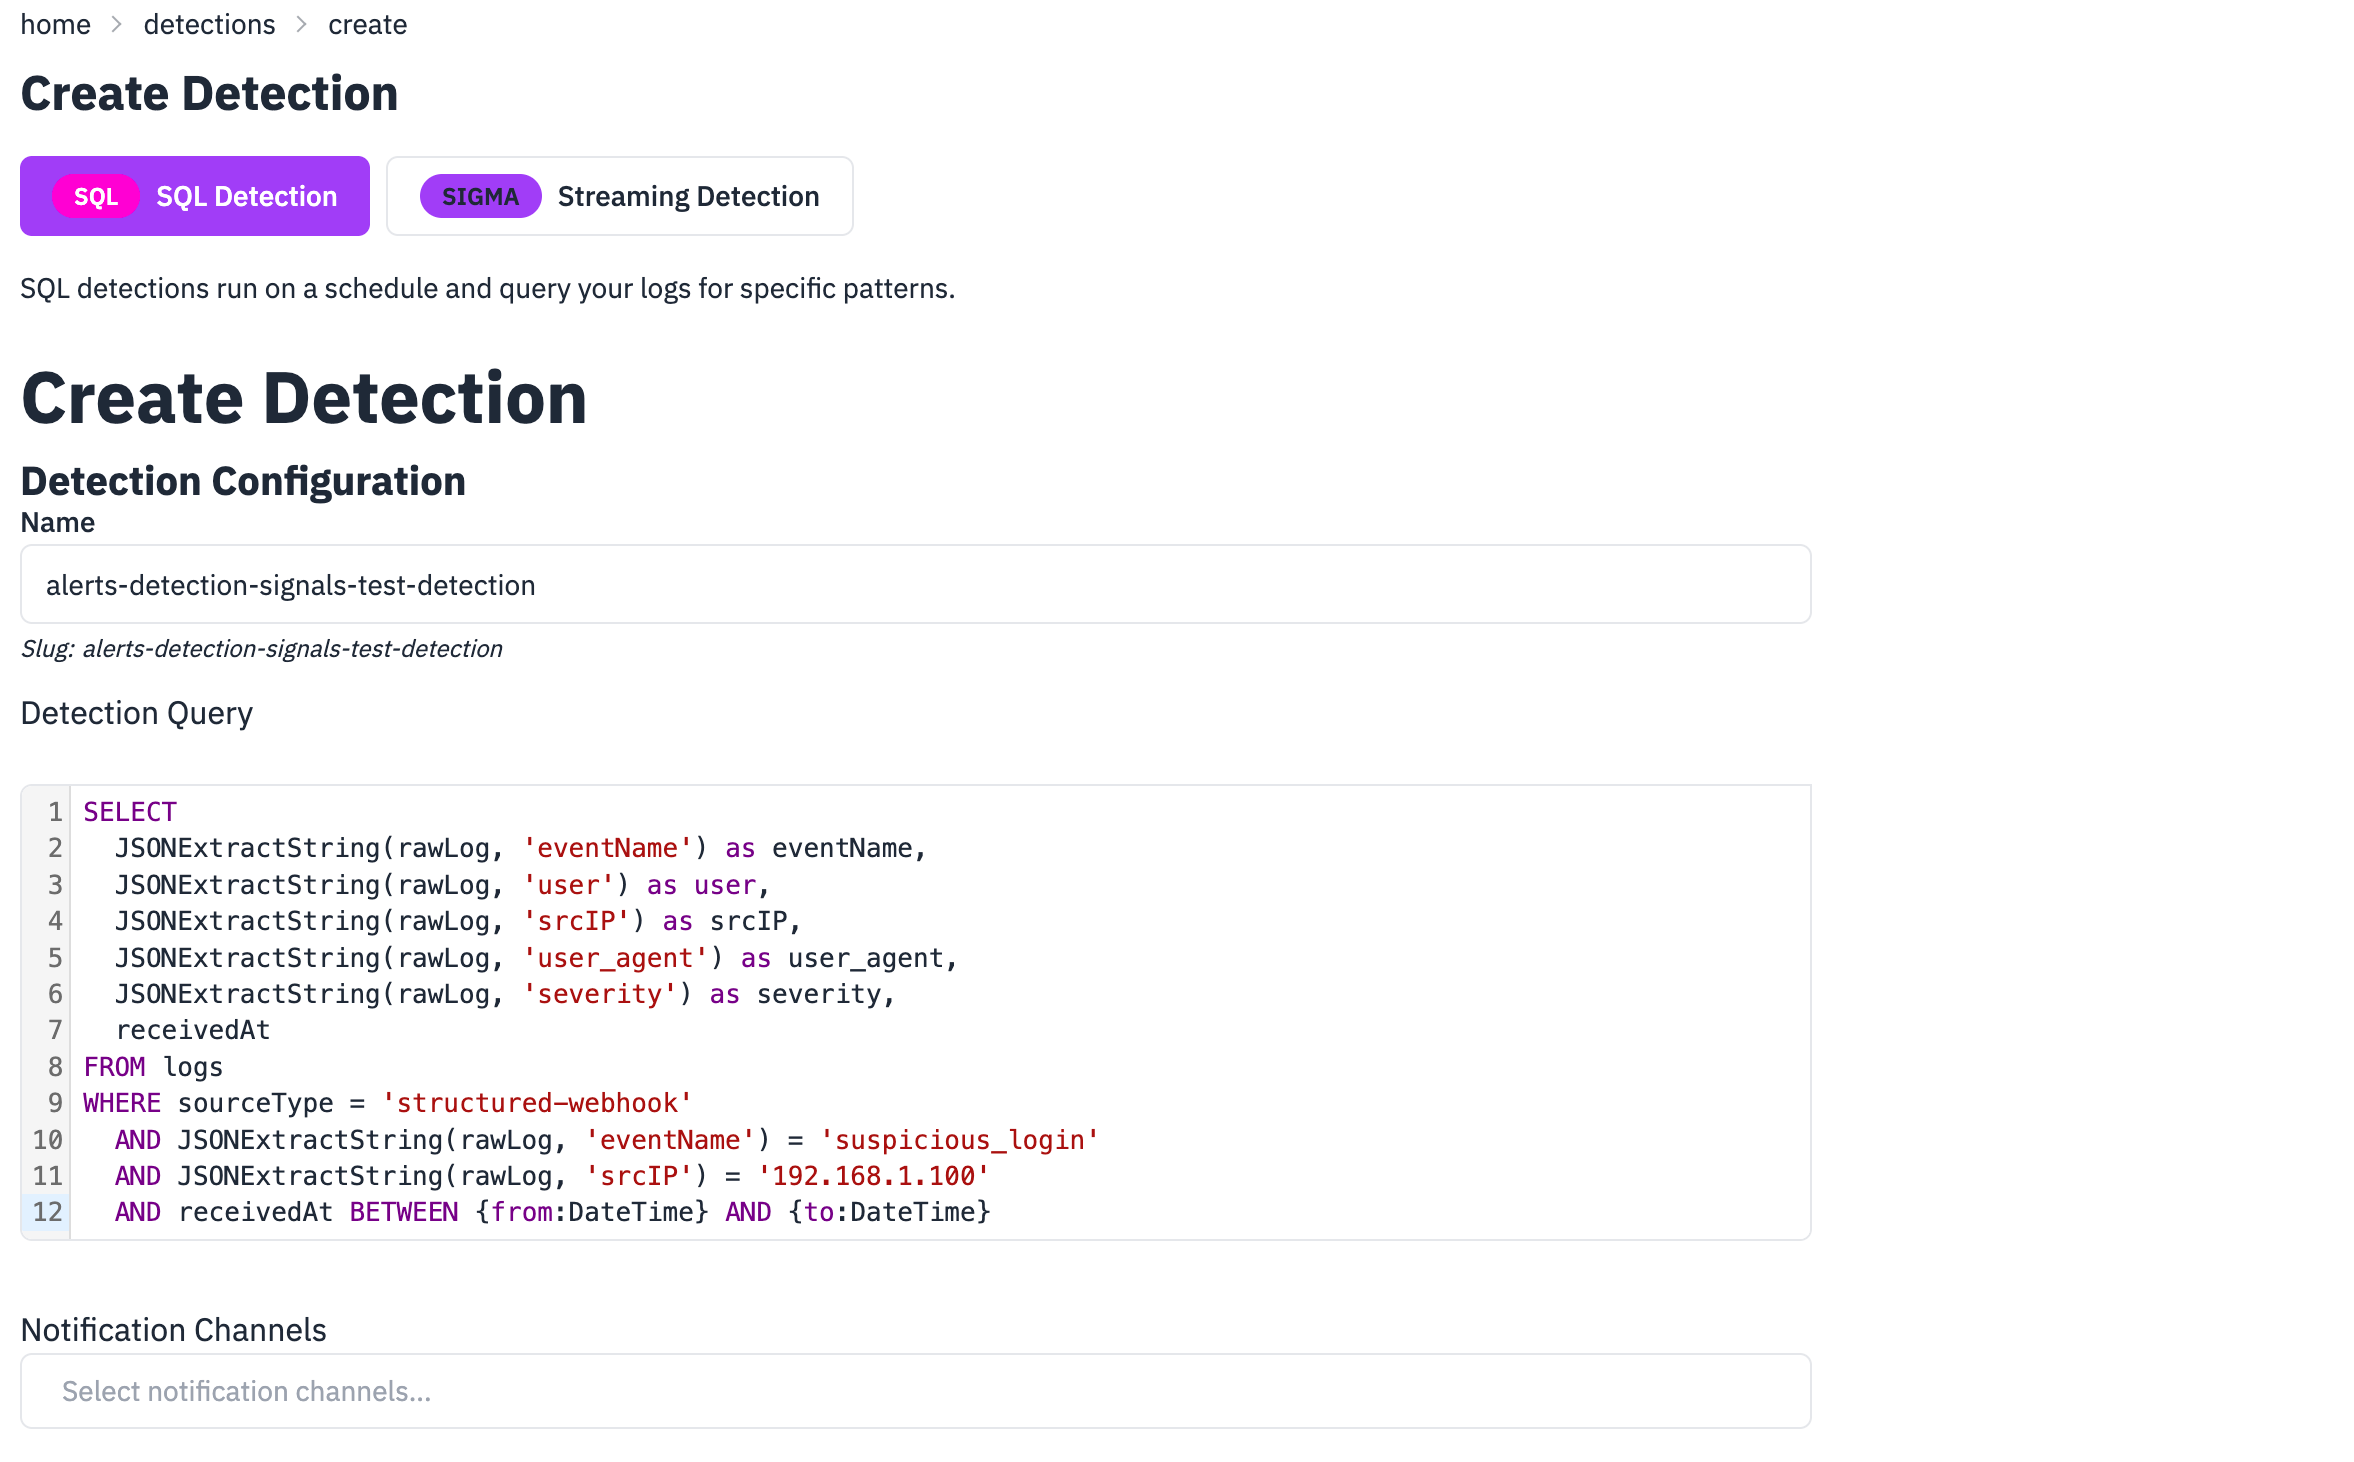
Step 3: Create a Test Detection Rule
Create a SQL detection that will trigger a signal from your test logs:
-
In RunReveal UI:
- Go to Detections > Create Detection
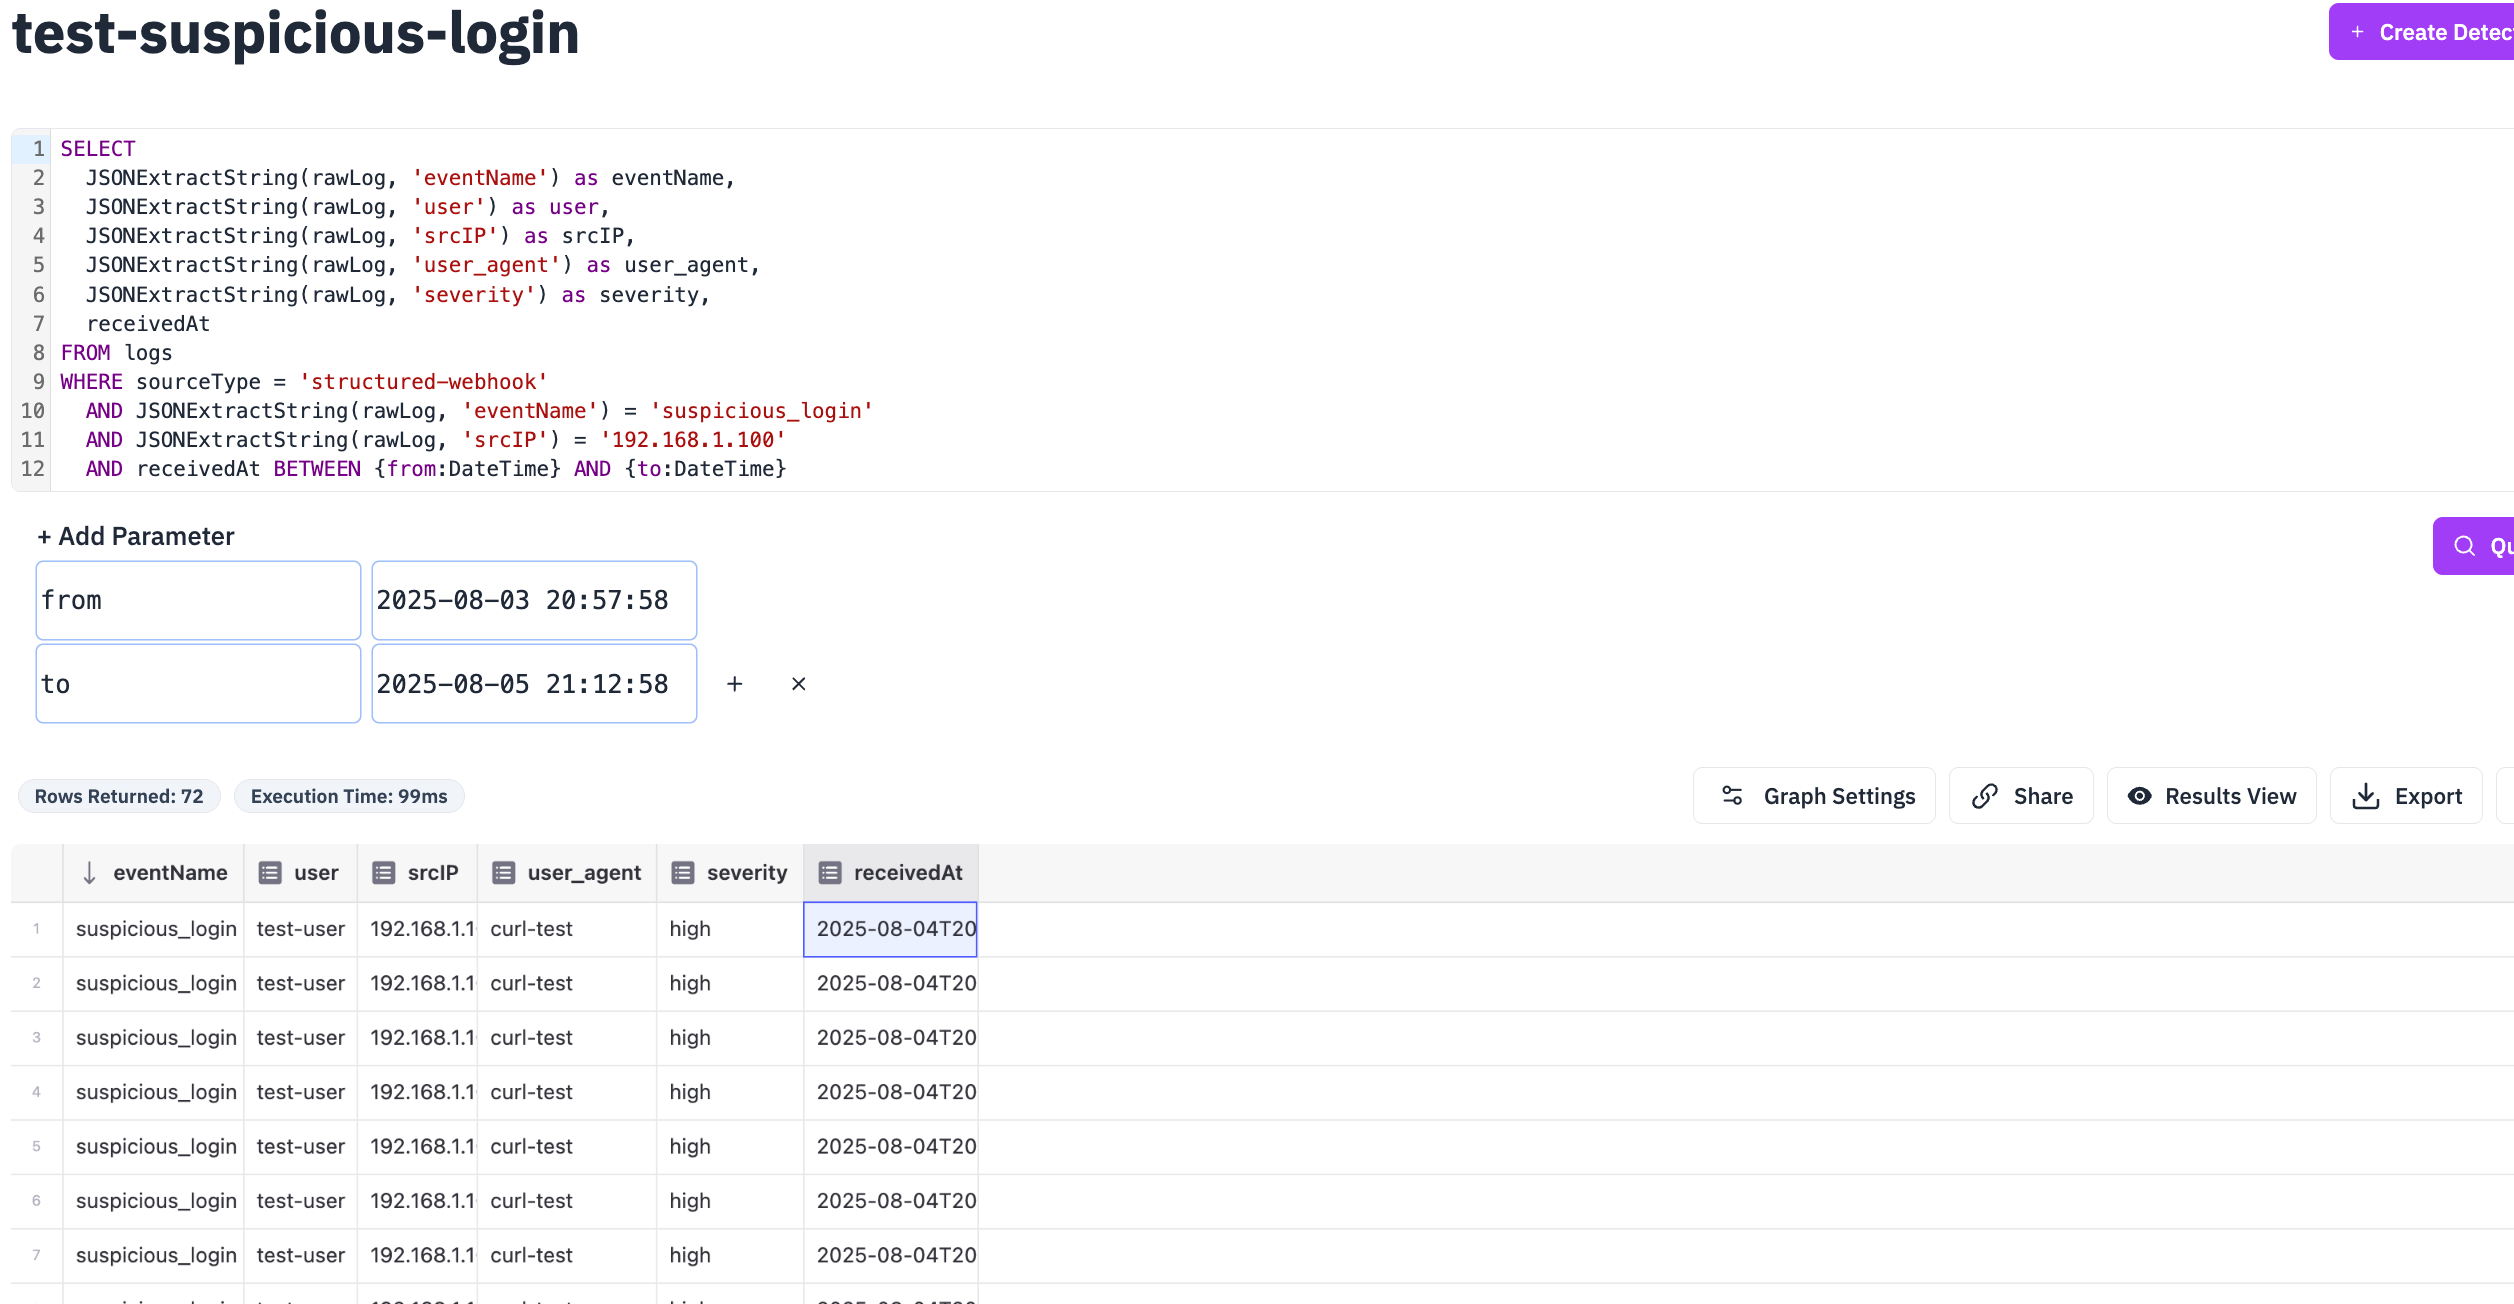
- Name:
test-suspicious-login - Type: SQL
- Query:
- Schedule:
*/5 * * * *(every 5 minutes) - Severity: Medium
- Categories:
["authentication", "test"] - Save (Signal will be generated as a notification channel was not configured)
Step 4: Validate and Test Detection using CLI (optional)
Validate Detection Syntax with Lint
Before testing your detection, validate the syntax and format using the lint command. This catches common errors early and ensures your detection will work properly.
-
For SQL detections:
-
For Sigma detections:
-
Expected output for successful validation:
-
If validation fails, fix the errors before proceeding:
Lint Benefits:
- Catches syntax errors before testing
- Validates required fields and structure
- Ensures compliance with Sigma/SQL standards
- Saves time by catching issues early in the development process
Test your detection to verify it works
-
Install and configure CLI:
-
Install RunReveal CLI:
-
Connect to your workspace:
Follow the prompts to authenticate and select your workspace
For complete CLI reference, see CLI Documentation.
-
-
For SQL detections (queries workspace data):
-
Create SQL detection configuration file:
Create file:
test-suspicious-login.yaml -
Create SQL query file:
Create file:
test-suspicious-login.sql -
Test the SQL detection:
Note: SQL detections must query real workspace data. Make sure you've sent test events via webhook (Step 2) before running this command.
-
-
For Sigma detections (tests with local samples):
-
Create Sigma detection file:
Create file:
test-suspicious-login-sigma.yaml -
Create sample data file:
Create file:
sample-events.ndjsonYou can copy whole events from RunReveal Dashboard and use it as is, or do the necessary changes to the data to ensure the detection will match what you are looking for.
Important: NDJSON format requires one JSON object per line with NO commas between lines and NO array brackets.
-
Test the Sigma detection:
✓ Shows which events in the sample file would trigger the detection
-
Expected output for successful detection test:
-
Understanding Detection Data Flow
- SQL Detections: Query the raw
logstable directly, usingJSONExtractString(rawLog, 'field')to extract values - Sigma Detections (CLI testing): Expect normalized/extracted fields as they would appear after processing
When creating sample data for Sigma CLI testing, provide the fields as if they've already been extracted from rawLog.
Step 5: Trigger and Review Detection
-
Manual Execution:
- Navigate to Detections
- Find your
test-suspicious-logindetection - Click Run Detection to execute it manually
- Wait a few seconds for execution to complete which will generate a signal
-
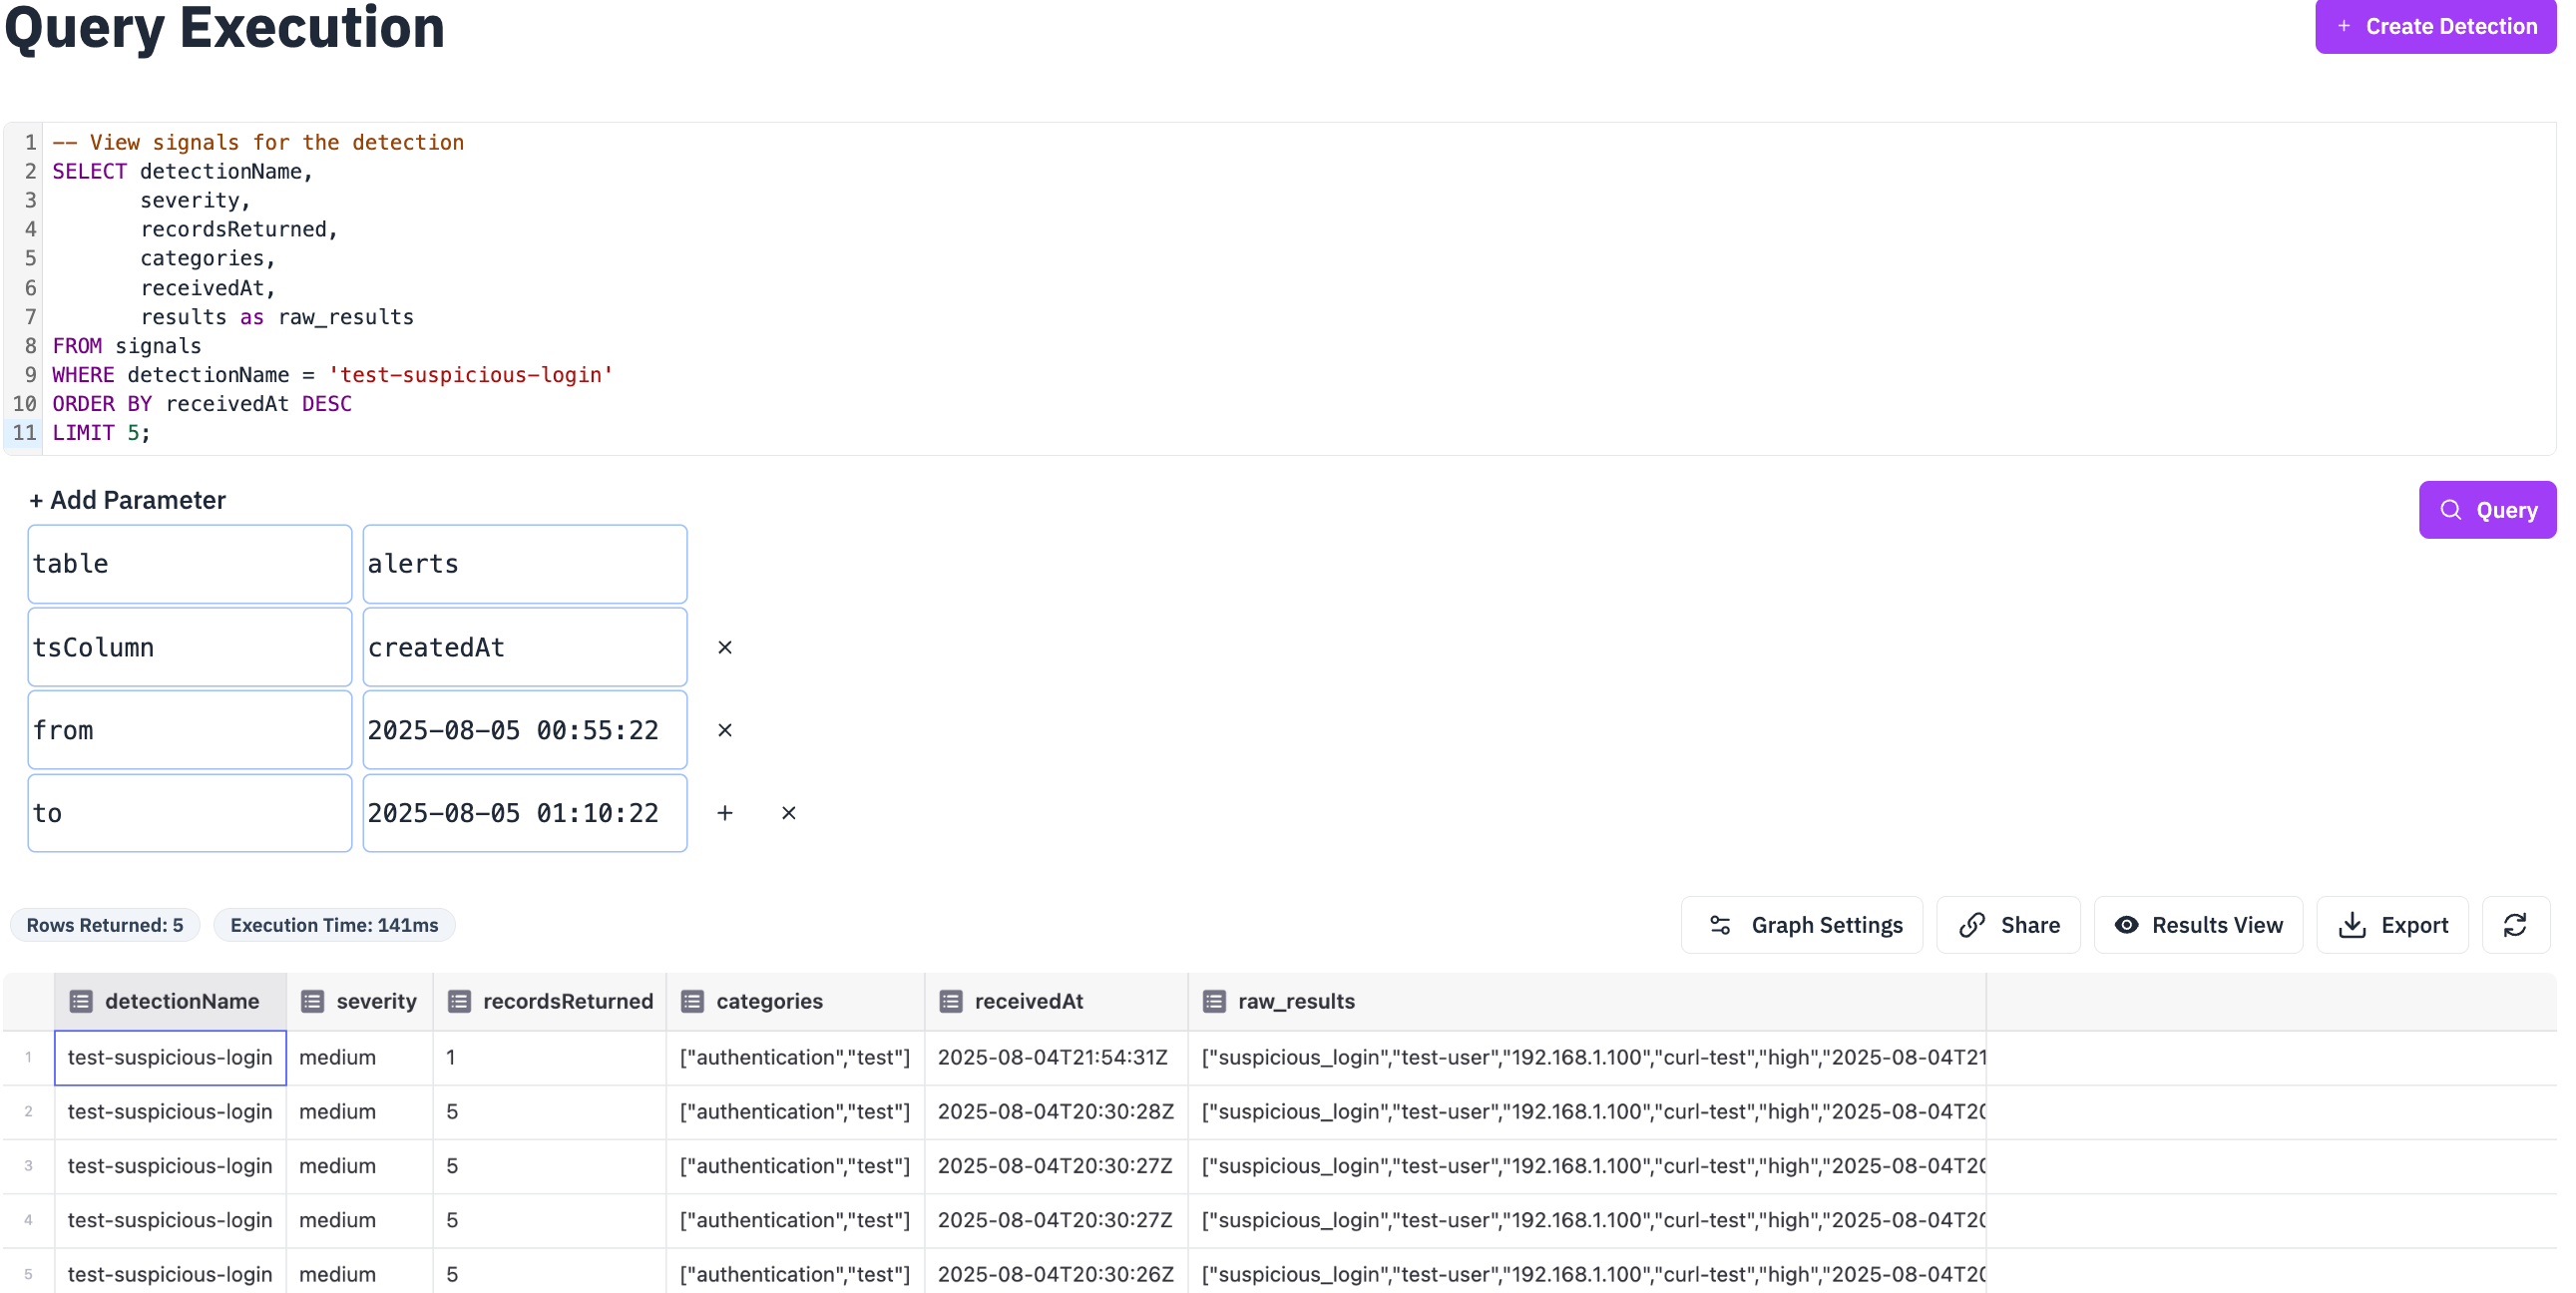
Check signals view:
Step 6: Compare Signal vs Alert
Now convert your detection to an alert:
-
Add notification channel:
- First, add a Notification Channel (email, Slack, etc.) in RunReveal UI
-
Edit detection:
- Edit
test-suspicious-logindetection - Attach the notification channel to the detection
- Save changes
- Edit
-
Send another test event:
-
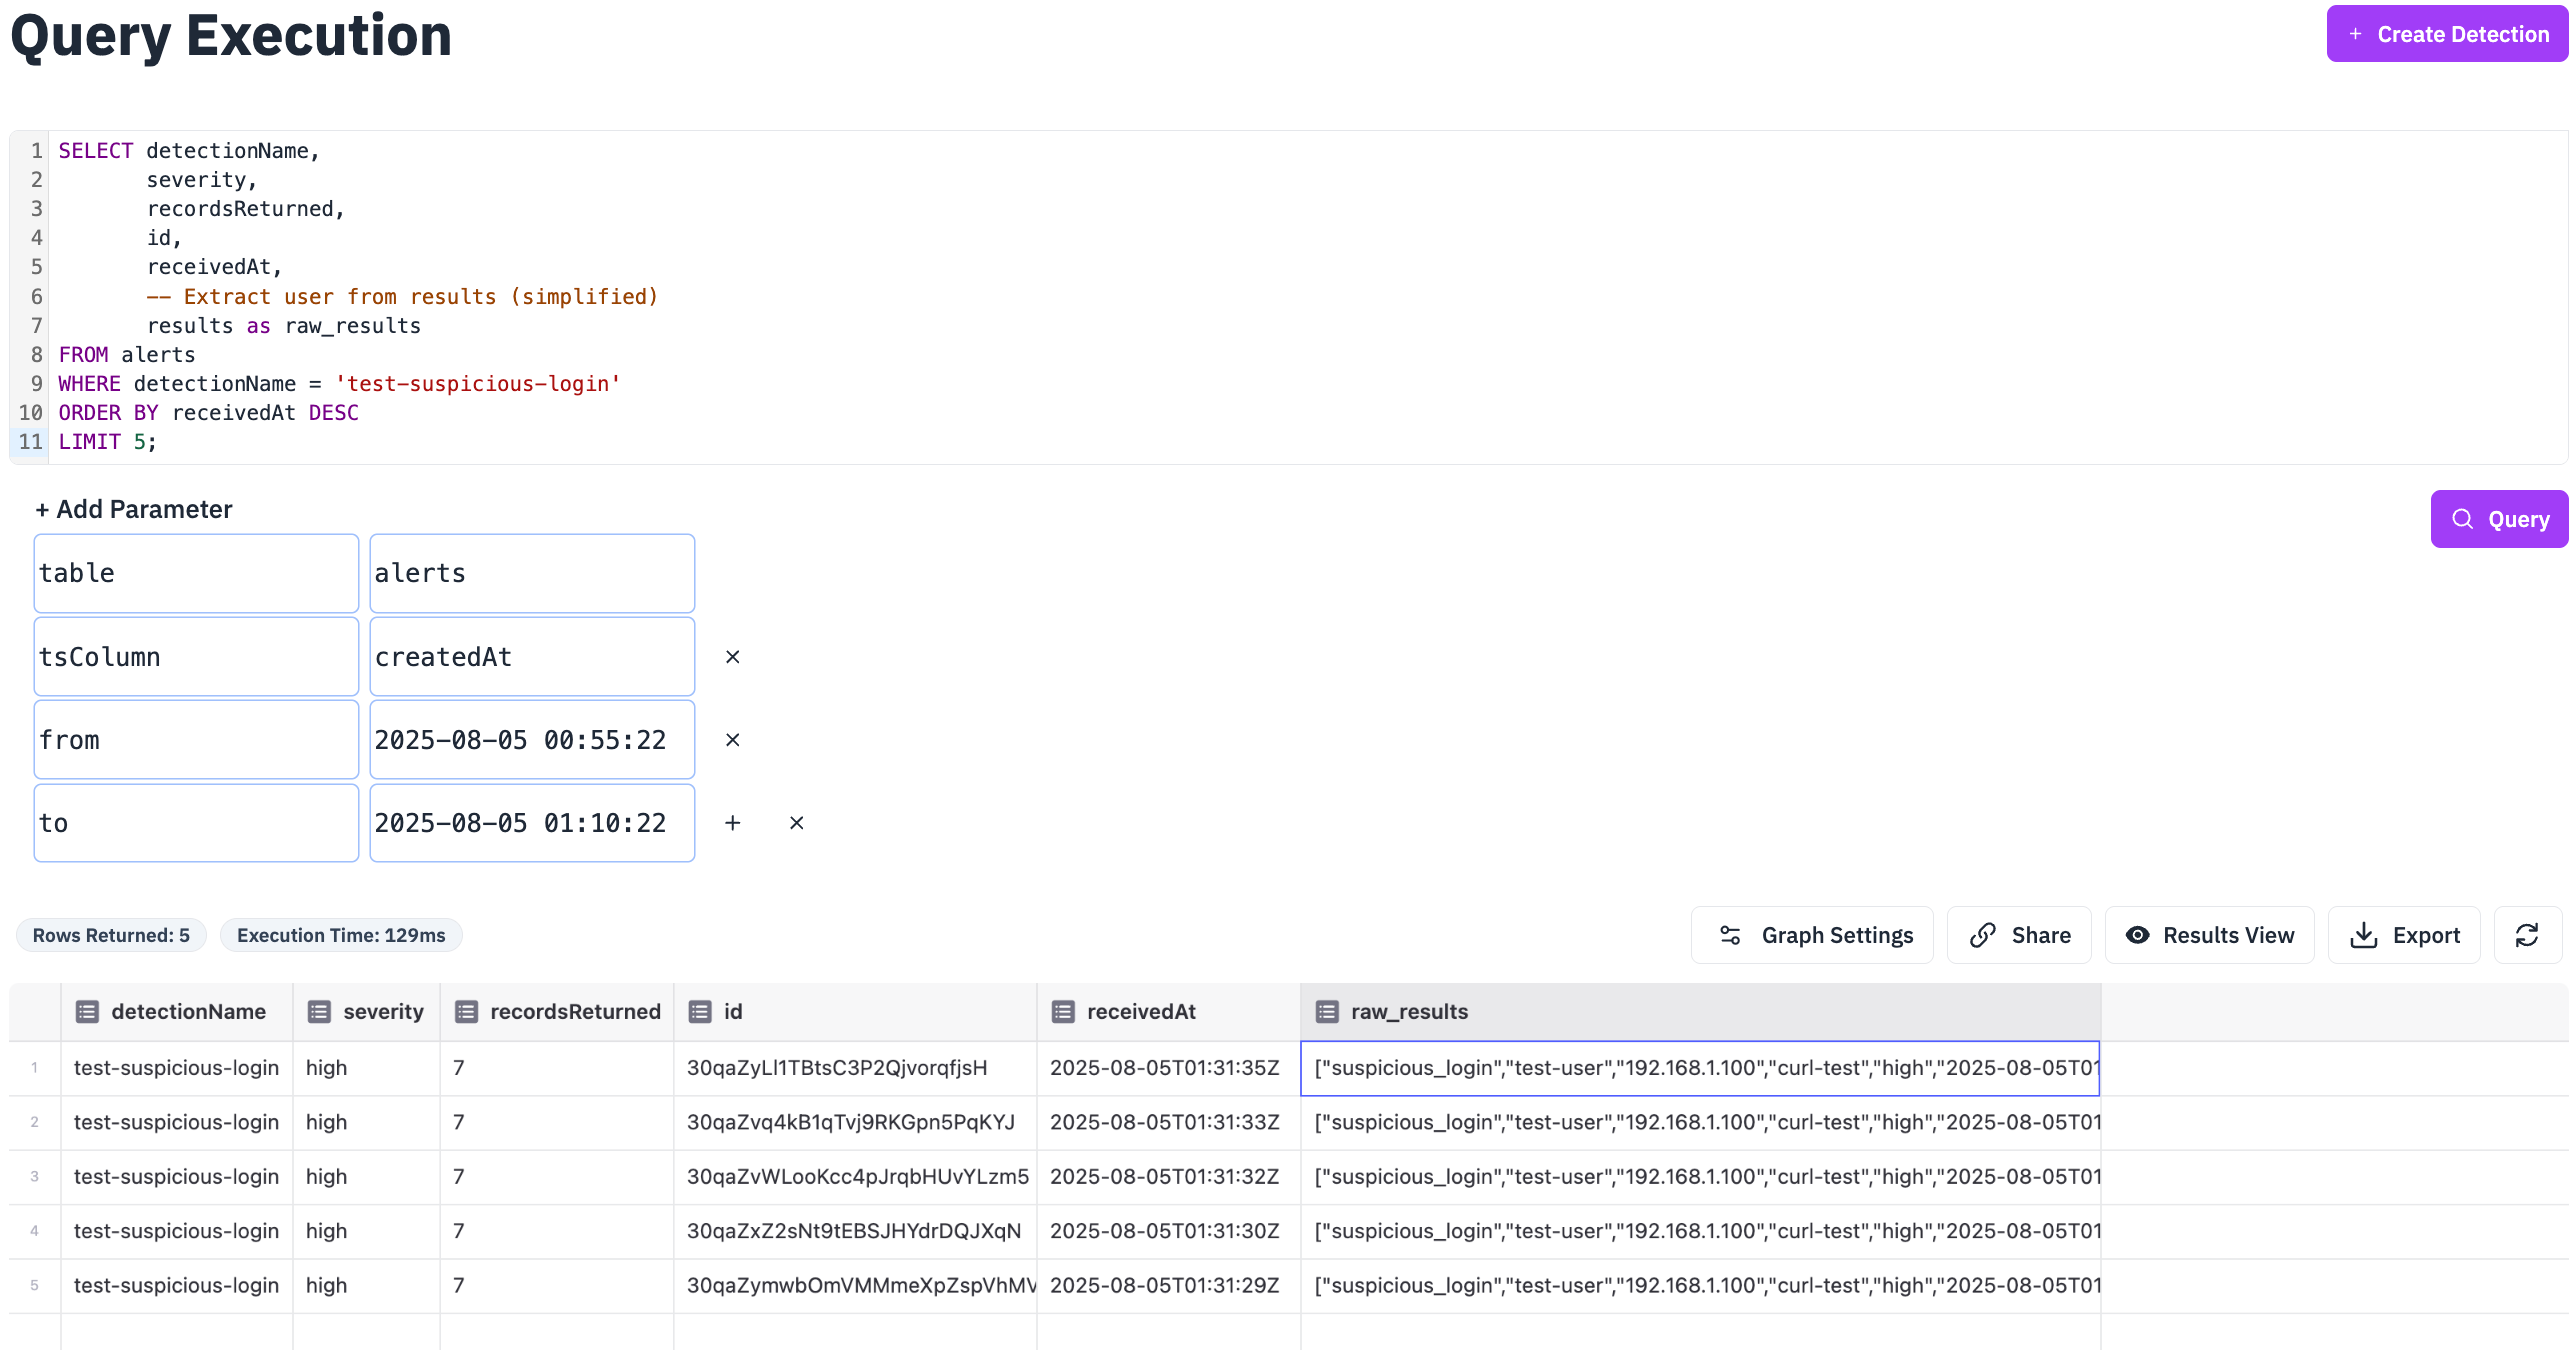
Wait 5 minutes, then compare the signal results:
-
To the alerts results:
-
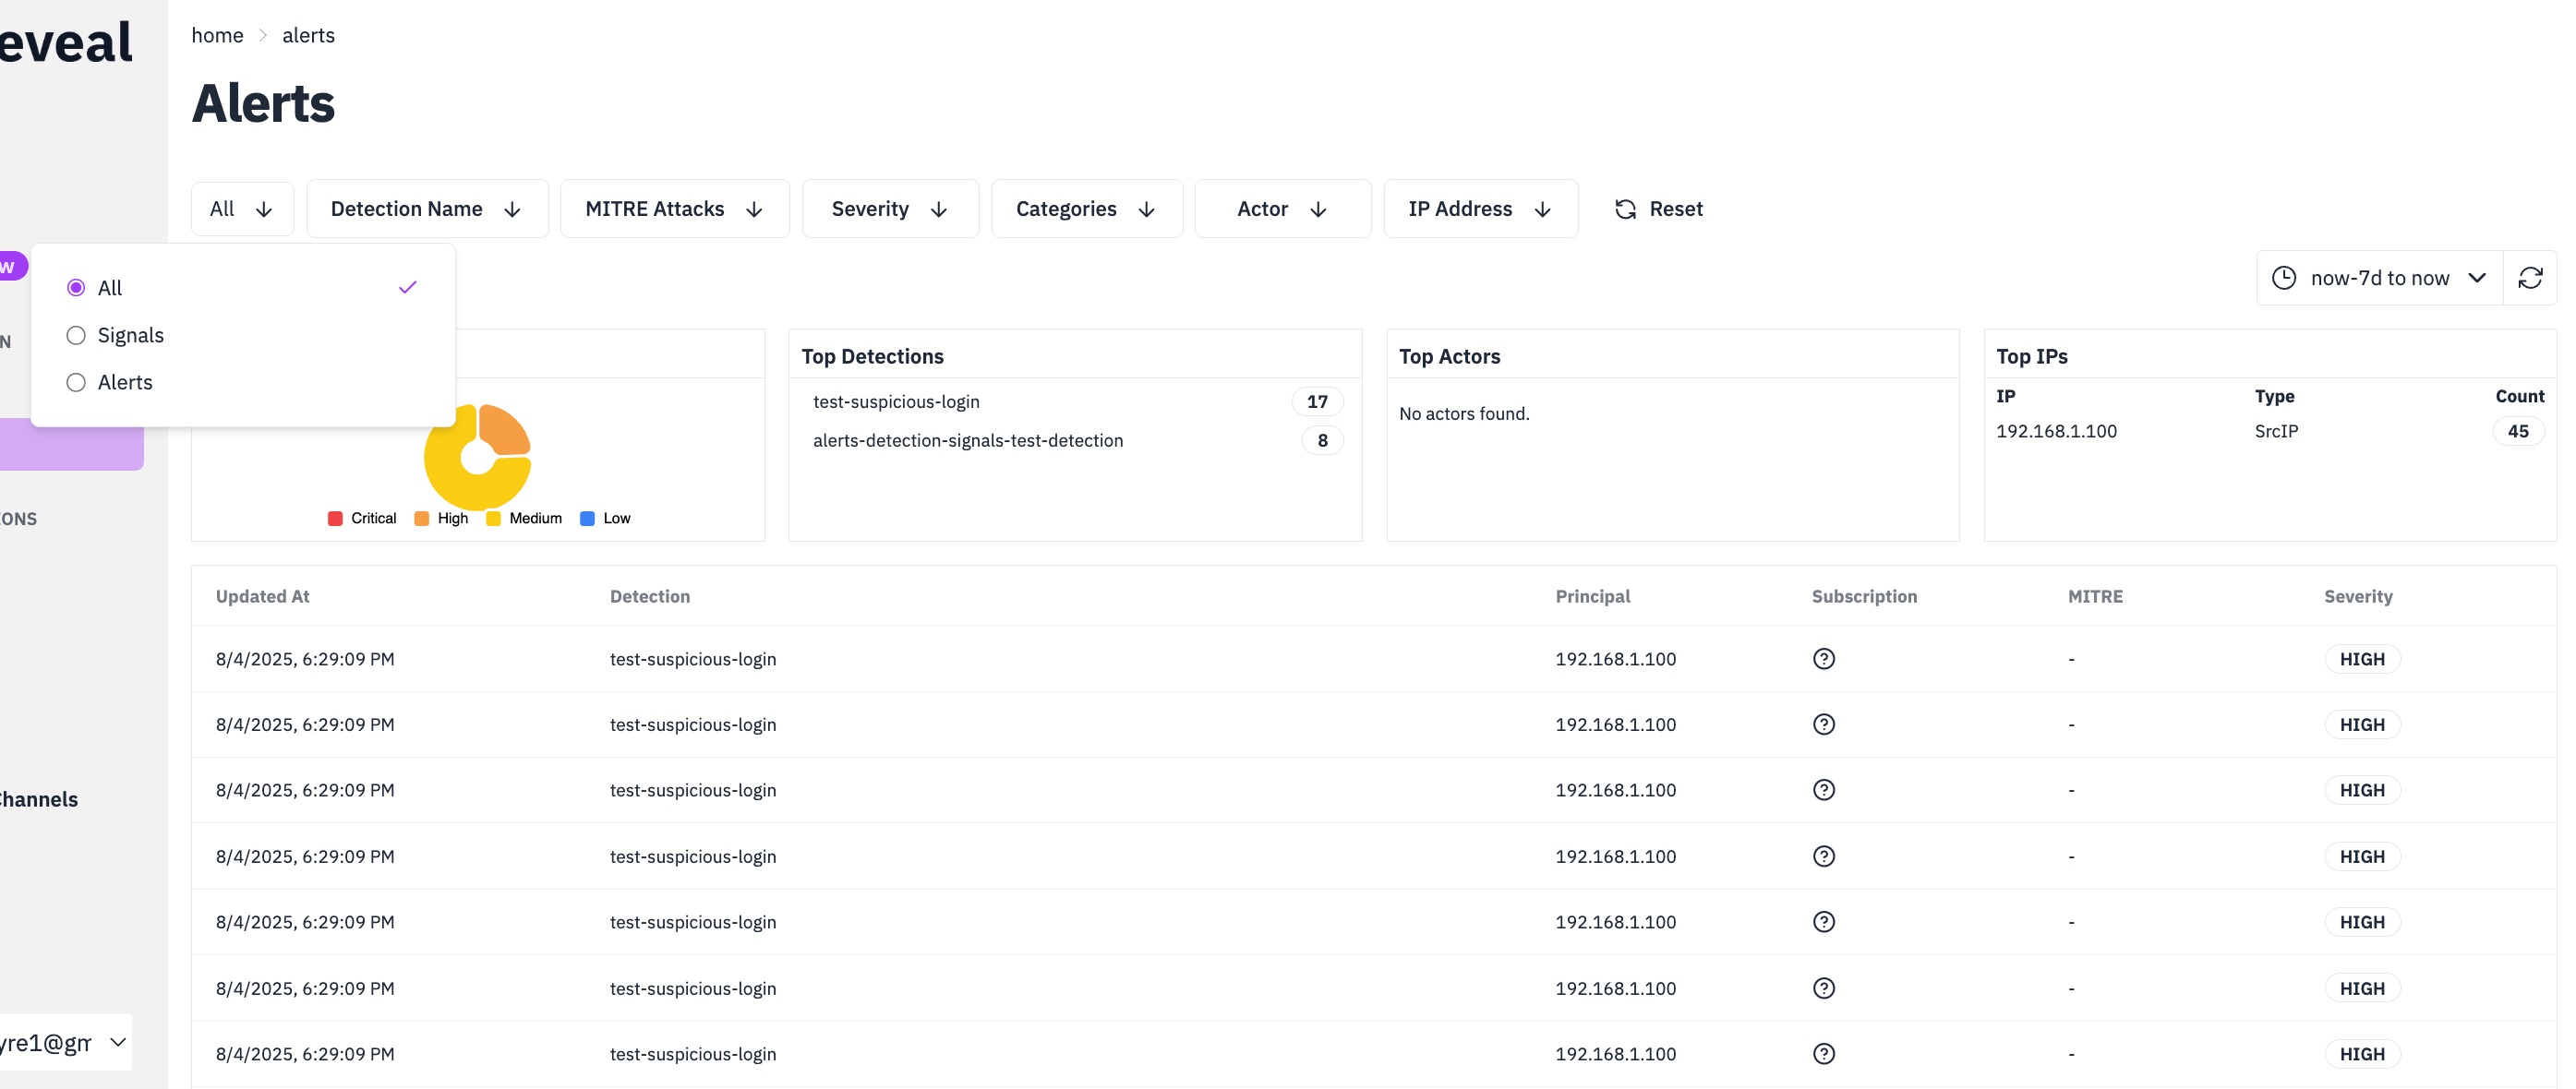
Compare in RunReveal UI:
- Navigate to the Alerts page in RunReveal UI
- Use the dropdown filter to switch between All, Alerts, and Signals
- Compare the results:
- Signals: Shows detection results without notifications
- Alerts: Shows detection results that triggered notifications
- All: Shows both signals and alerts together
Suggested Workflow
- Start with Signals → Validate detection logic without noise
- Tune the rule → Adjust query logic and thresholds
- Convert to Alert → Add notifications when ready for production
- Monitor performance → Track execution times and match rates
Next Steps
Now that you have detections, signals, and alerts set up, explore the detailed configuration guides:
- Detections - Create and manage security detection rules
- Sigma Streaming - Use Sigma rules for standardized threat detection
- Detection as Code - Manage detections through code and version control
- Sources - Set up data collection from your systems
- Pipelines - Configure data processing workflows
- Notifications Getting Started - Set up alerting and notification channels
- AI Chat - Use AI-powered analysis for threat hunting and investigation
- Enrichments - Add context and metadata to your security events