Detections
Detections currently are queries that execute on a schedule and their results of all queries that are run are saved to our underlying database. You can view the historic detection queries that have run on the RunReveal platform by searching several underlying tables.
scheduled_query_runs- The results of all scheduled query runs, their execution times, the number of rows they returned, and parameter values that were passed to them.detections- The rows that your detection queries return. These results contain the metadata of the associated detection, like risk score, mitre attacks, etc.
Learn more about CI/CD for detections: Check out our guide on Building a CI/CD Pipeline for RunReveal Detections to learn how to implement automated testing and deployment workflows for your detection-as-code setup.
Anatomy of a Detection
A detection in RunReveal consists of several components that work together to identify security events. Understanding these components helps you create effective detections and manage them efficiently.
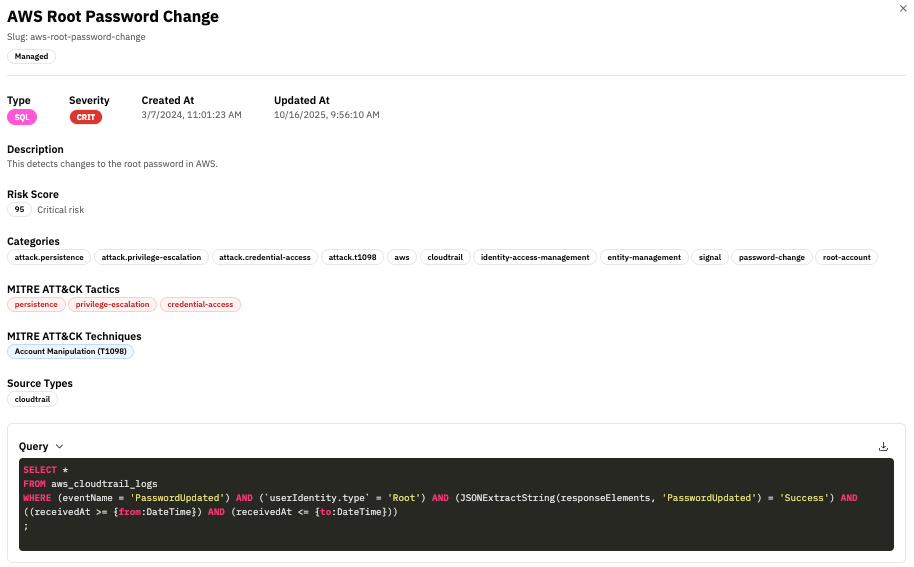
Detection Metadata
The metadata section provides identity and operational context for the detection:
| Field | Description |
|---|---|
| Title | Human-readable name of the detection (e.g., "AWS Root Password Change") |
| Slug | URL-friendly identifier used in APIs and detection-as-code workflows |
| Type | Detection language: SQL or Sigma |
| Severity | Classification level (Low, Medium, High, Critical) used for triage and prioritization |
| Created / Updated | Timestamps showing detection lifecycle and last review time |
This metadata enables filtering, searching, and organizing detections across your security operations.
Description and Risk Assessment
| Field | Description |
|---|---|
| Description | Human-readable explanation of what the detection identifies |
| Risk Score | Numeric value (0-100) representing the criticality of the detected activity |
The risk score enables automated prioritization, dashboard visualization, and correlation with other security events.
Categories and Tags
Categories and tags provide taxonomy for organizing detections and mapping them to security frameworks:
| Category Type | Purpose | Examples |
|---|---|---|
| Attack Context | MITRE ATT&CK mapping | attack.persistence, attack.credential-access |
| Service Provider | Platform identification | aws, azure, gcp, github |
| Security Category | Security Domain classification based on OCSF Schema | password-change, privilege-escalation |
| System Context | Operational context | identity-access-management, network-security |
| Signal Classification | Distinction between signal and alert | signal, non-signal |
These fields enable flexible filtering in dashboards, documentation, and API queries.
MITRE ATT&CK Mapping
| Field | Description |
|---|---|
| Tactics | High-level adversary objectives (e.g., persistence, privilege-escalation, credential-access) |
| Techniques | Specific adversary behaviors (e.g., T1098 - Account Manipulation) |
MITRE ATT&CK mapping provides standardized threat classification for threat hunting, reporting, and framework alignment.
Source Types
Source types specify which log sources the detection runs against (e.g., cloudtrail, github, okta). RunReveal uses this to:
- Validate queries against normalized schemas
- Route detections to appropriate data sources
- Ensure compatibility with source-specific views and tables
Query Logic
The query logic is the core detection body that contains the actual SQL or Sigma pattern used to identify security events. Key components include:
- Data Source: The table or view being queried (e.g.,
aws_cloudtrail_logs,logs) - Filter Conditions: Criteria that identify suspicious activity
- Time Windows: Templated placeholders (
{from:DateTime},{to:DateTime}) for scheduled execution
This is the executable logic that performs the actual detection work.
Detection Layers
A detection can be understood as four interconnected layers:
| Layer | Purpose | Components |
|---|---|---|
| Metadata | Identification and versioning | Title, slug, type, timestamps |
| Classification | Risk and framework mapping | Severity, risk score, MITRE ATT&CK, categories |
| Execution Context | Source and schema bindings | Source types, query parameters |
| Logic | Detection pattern | SQL query or Sigma rule |
Together, these layers make a detection both machine-executable (for automated analysis) and human-readable (for documentation, audits, and analyst review).
Utilizing scheduled_query_runs
If you are curious if a query of yours is executing, failing, erroring, or your parameters are being passed correctly, the scheduled_query_runs table is exceptionally helpful.
For example, here's a way to look for errors that have occurred while executing in a detection called 'ExampleQuery'.
This information is also available in the Source > Overview > Errors page, or [the combined source errors view[(https://app.runreveal.com/dash/sources/errors).
SQL vs Streaming Detections
RunReveal supports two types of detections: SQL and Streaming (Sigma). Understanding the differences helps you choose the right approach for your use case.
SQL detections are scheduled queries that execute against your log data at regular intervals. They provide full SQL query capabilities and can perform complex analysis, aggregations, contexts, and joins.
Characteristics:
- Execution: Runs on a schedule (e.g., every 5 minutes, hourly)
- Language: Standard ClickHouse SQL
- Data Access: Queries the
logstable and custom views - Use Cases: Complex queries, aggregations, historical analysis, pattern detection across time windows
When to use SQL detections:
- You need complex queries with joins, aggregations, or window functions
- You want to analyze patterns across multiple events or time periods
- You need to query custom views or perform data transformations
- You want to detect patterns that require historical context or correlation
Learn more about writing SQL detections in the How to Write Detections guide.
Comparison
| Feature | SQL Detections | Streaming Detections |
|---|---|---|
| Execution Model | Scheduled (batch) | Streaming (real-time) |
| Query Language | ClickHouse SQL | Sigma YAML |
| Complexity | Full SQL capabilities | Pattern matching focused |
| Custom Views | Supported | Not supported |
| Historical Analysis | Yes | No |
| Real-time Detection | No (scheduled) | Yes (streaming) |
| Rule Sharing | Custom SQL | Standardized Sigma format |
Choosing the Right Type
- Use SQL when you need complex analysis, aggregations, or historical correlation
- Use Sigma when you need real-time detection of simple patterns or want standardized, shareable rules
Many organizations use both types: Sigma for real-time threat detection and SQL for complex analysis and pattern recognition across time windows.
Managed Detections
RunReveal ships a Detection Library of curated SQL and Sigma rules maintained by RunReveal. You subscribe to managed detections in your workspace instead of authoring every rule from scratch—ideal for common cloud, identity, and SaaS threat patterns.
In the app
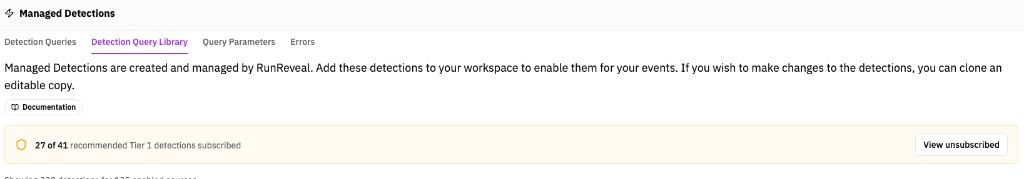
- Go to Detections → Detection Query Library (Managed Detections) to browse and subscribe to SQL managed detections (use Sigma Detection Library under Managed Detections for streaming Sigma rules).
- Use View Unsubscribed to see rules not yet enabled for your workspace.
- Open a detection to review description, severity, MITRE mapping, and required source types.
- Subscribe to enable the rule; configure notifications, parameters, and optional AI triage on the subscription.
CLI and automation
Subscribe via the CLI managed-detections commands or sync packs from the public detection packs repository. See Detection as Code for CI/CD workflows.
Managed detection subscriptions appear alongside your custom detections in the app. Results still land in the detections, signals, and alerts tables described below depending on how you configure notifications.
Tier 1 Detections
Tier 1 managed detections are high-signal rules RunReveal recommends for your connected sources. They are tagged with the tier-one category in the Detection Library and are designed for fast time-to-value: centralize alerts from your stack, correlate them with the rest of your logs, and focus on risky activity that is infrequent but important.
When you subscribe to a Tier 1 detection, AI triage is enabled by default (where configured on the pack). Each alert can automatically open an investigation with a short summary and agent analysis—so a small team can run a complete detection-and-response program without staffing a full SOC.
Use View Unsubscribed on the Tier 1 banner in the Detection Query Library to see which recommended Tier 1 managed detections you have not enabled yet.
Enable Tier 1 detections
- Connect the log sources relevant to your environment.
- Go to Detections → Detection Query Library (Managed Detections).
- On the Tier 1 banner (shield icon), check how many recommended detections you already subscribe to—for example, “27 of 41 recommended Tier 1 detections subscribed”.
- Click View Unsubscribed on that banner to see the Tier 1 managed detections RunReveal recommends for your enabled sources that are not yet in your workspace. Review each rule, then subscribe to enable the ones that apply.
- Optionally use the Tier 1 filter in the library to browse all Tier 1 rules (subscribed and unsubscribed).
- Review completed triage under Investigations.
The walkthrough below shows investigated cases with human-readable summaries after Tier 1 detections are enabled (from Introducing Tier 1 Detections on the RunReveal blog).
You can tune individual detections, swap the triage agent, and adjust notification channels on each subscription. The defaults are meant to take you from no detection program to a solid foundation in an afternoon.
Learn more: Automatically Investigate What Matters: Introducing Tier 1 Detections — product overview and philosophy. For investigation workflow details, see Investigations and Automated Investigations.
Detections, Signals, and Alerts Tables
RunReveal provides three related tables for managing detection results: detections, signals, and alerts.
Overview
Detections: The base table that stores all detection query results, regardless of notification configuration.
Signals: A view of detections that have no notification channels configured (notificationNames is empty), representing potential security events that require investigation but haven't triggered alerts.
Alerts: A view of detections that have notification channels configured (notificationNames is not empty), representing security events that have been escalated through configured notification channels.
Relationship Between Tables
detections= All detection results (base table)signals=detectionsWHEREempty(notificationNames) = 1(no notifications configured)alerts=detectionsWHEREempty(notificationNames) = 0(notifications configured)
The detections table contains a row for each individual row returned by your query. Fields returned by your query that match the column names of our defined schema are saved directly into those columns in the detection table.
Schema
All three tables share the same schema structure. The following columns are available:
| Column | Type | Description |
|---|---|---|
id | String | Unique identifier for the detection result |
scheduledRunID | String | Identifier for the scheduled detection run |
workspaceID | String | Workspace identifier |
detectionID | String | Unique identifier for the detection rule |
detectionName | String | Human-readable name of the detection |
detectionType | LowCardinality(String) | Type of detection (e.g., "sql", "sigma") |
recordsReturned | Int32 | The number of rows returned by the detection query |
runTime | Int64 | The number of nanoseconds the query took to run |
query | String | The actual SQL query that was executed |
params | Map(String, String) | The parameters supplied to the scheduled query |
columnNames | Array(String) | An ordered array of column names returned by the query |
columnTypes | Array(String) | An ordered array of the column types returned by the query |
results | String | A JSON array of the first 100 returned values from the query |
riskScore | Int32 | The risk score associated with the detection (0-100) |
severity | String | The severity level of the detection (e.g., "low", "medium", "high", "critical") |
actor | Map(String, String) | Details about the user/actor that triggered the detection (e.g., email, username, id) |
resources | Array(String) | Details about the resources affected by the detection |
srcIP | String | Source IP address from the log entries |
dstIP | String | Destination IP address from the log entries |
categories | Array(String) | The categories that the detection belongs to |
mitreAttacks | Array(LowCardinality(String)) | The MITRE ATT&CK technique IDs that the detection maps to |
notificationNames | Array(String) | The names of the notification channels configured for this detection (available in detections and alerts tables, not in signals view) |
error | String | Error message if the query failed to execute |
createdAt | DateTime | The timestamp when the detection query ran |
eventTime | DateTime | The timestamp when the underlying security event occurred |
receivedAt | DateTime | The timestamp when RunReveal received the event |
Basic Queries
These tables can be accessed like any other table in RunReveal:
Example Use Case: Creating Alert Conditions from Signals
A common use case is to query the signals table to identify patterns that should trigger alerts. For example, you might want to create an alert when multiple high-risk signals occur for the same actor within a short time window.
Best Practice: Use receivedAt for all time-based filtering and queries. The receivedAt timestamp represents when RunReveal received the event and is the most reliable field for time-based analysis. Use createdAt only when you need to know when the detection query executed, and eventTime when you need the original event timestamp.
This query can be used as a detection rule that monitors the signals table and creates alerts when the conditions are met. The detection would:
- Query the
signalstable for high-risk events in the last hour usingreceivedAt - Group by actor email and username
- Identify actors with 3 or more high-risk signals
- Create an alert with the aggregated information
Example: Analyzing Detection Trends
You can also query the detections table directly to analyze all detection activity, regardless of notification status:
This query provides insights into:
- Which detection types are most active
- The distribution of alerts vs signals
- Average risk scores by type and severity
- Number of unique actors involved
Complete Example: From Log to Detection to Signal-Based Alert
This example demonstrates the complete workflow from a log entry, to a detection query that creates signals, to a detection that monitors the signals table to create alerts. We'll use a test authentication log to walk through the process.
Step 1: Example Log Entry
Here's a sample log entry sent via a structured webhook showing a suspicious login attempt:
To send this log to RunReveal, use a structured webhook source:
Step 2: Detection Query That Creates Signals
Create a detection that identifies suspicious login attempts. This detection will write to the signals table (since no notification channel is configured):
Detection Configuration:
- Name:
Suspicious Login Attempts - Type: SQL
- Schedule:
*/5 * * * *(every 5 minutes) - Severity: Medium
- Risk Score: 50
- Categories:
["authentication", "security"] - Notification Channels: None (this creates signals, not alerts)
This detection will:
- Match the example log entry (suspicious login with high severity)
- Return results with user, source IP, and login method information
- Create signals in the
signalstable for investigation and tuning
Step 3: Detection Querying the Signals Table
Create a second detection that monitors the signals table to identify when multiple suspicious login signals occur from the same source IP. This simple pattern indicates potential brute force attacks:
Detection Configuration:
- Name:
Multiple Suspicious Login Signals from Same IP - Type: SQL
- Schedule:
*/10 * * * *(every 10 minutes) - Severity: High
- Risk Score: 75
- Categories:
["authentication", "brute-force"] - Notification Channels: Email, Slack, or PagerDuty (this creates alerts)
This detection would:
- Query the
signalstable for "Suspicious Login Attempts" detection results - Group by source IP address
- Identify IPs with 5 or more suspicious login signals
- Create an alert when the threshold is met, escalating from individual signals to a pattern-based alert
Use Case: Account Compromise Detection
This pattern is useful for detecting:
- Brute force attacks: Multiple failed login attempts from different IPs
- Account takeover: Successful logins from unusual locations or devices
- Credential stuffing: Rapid login attempts across multiple accounts
- Session hijacking: Multiple concurrent sessions from different locations
Benefits of this approach:
- Reduce alert fatigue: Individual suspicious logins create signals for investigation
- Pattern recognition: Only alert when multiple signals indicate a real threat
- Tunable thresholds: Adjust signal count and time window based on your risk tolerance
- Contextual alerts: Aggregated alerts provide better context for incident response
Workflow:
- Individual suspicious logins → Create signals (no notifications)
- Security team reviews signals → Tune detection logic if needed
- Multiple signals for same user → Create alert (with notifications)
- Incident response team investigates → Take action based on alert context
Related Documentation
Now that you understand how to write effective detections, explore these related guides:
- How to Write Detections - Tips and tricks to write effective detections
- Detections, Signals & Alerts Quick Start Guide - Complete setup guide for your detection workflow
- Sigma Streaming - Use Sigma rules for standardized threat detection
- Detection as Code - Manage detections through code and version control
- Notifications - Set up alerting and notification channels
- Native AI Chat - Use AI to help write and optimize detections
- Model Context Protocol - Advanced AI integration for detection development