Investigations
Investigations provide a centralized workspace for tracking security incidents within RunReveal. Each investigation collects related artifacts—queries, alerts, chat conversations, notes, and indicators—into a single timeline, enabling teams to collaborate on complex incidents and maintain a comprehensive audit trail.
Check out our blog: For a deeper look at how investigations fit into incident response and automated triage—including walkthroughs and real-world workflows—see our post Introducing RunReveal's Autonomous Security Operations Agent.
Why Investigations?
- Centralized evidence: Link queries, alerts, AI chat sessions, and notes to a single investigation timeline
- Audit trail: Every status change and artifact addition is automatically tracked with timestamps and user attribution
- Collaborative workflow: Share investigation links with team members; everyone sees the same context
- Persistent context: Investigations persist across sessions, enabling multi-day incident response
What Can You Do with Investigations?
- Track incidents from initial alert through resolution
- Document root cause analysis with timestamped notes
- Link related detections and queries for evidence preservation
Common Use Cases
Setup Guide
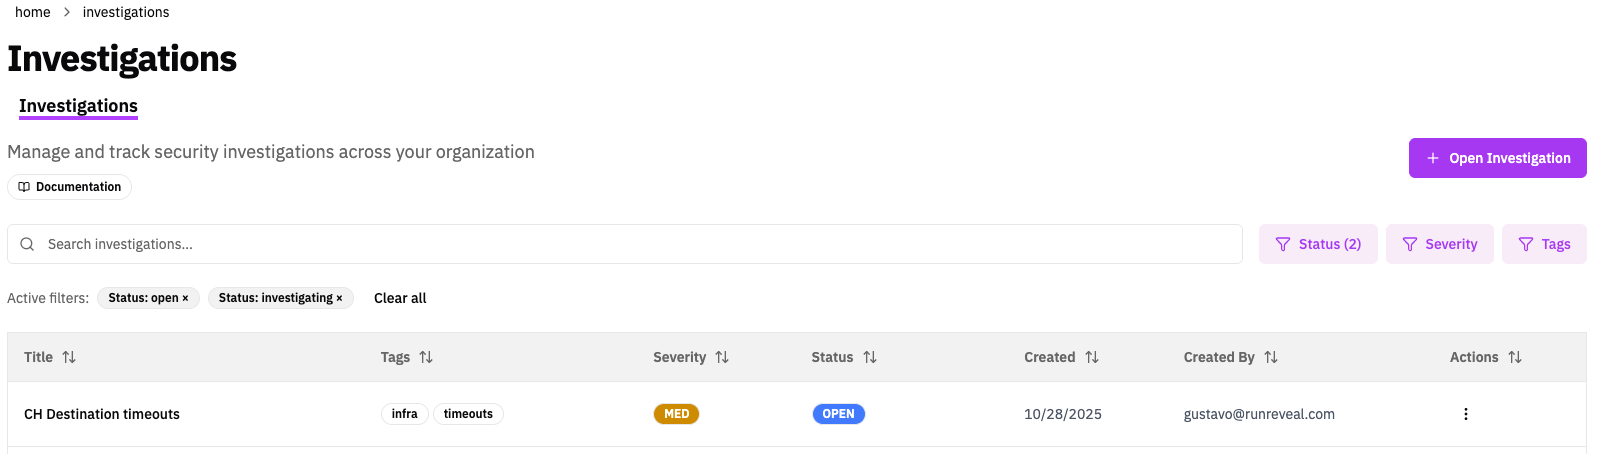
Navigate to Investigations
Go to Investigations in the sidebar and click Open Investigation.
Configure Investigation Details
Provide the following:
- Title: Descriptive name (required, 1-100 characters)
- Description: Context for what you're investigating
- Severity:
low,medium,high, orcritical - Status:
open(default),investigating, orclosed - Classification:
true_positive,false_positive, orinconclusive(optional; can also be set when closing) - Tags: Custom labels for categorization and filtering
Start Investigating
Click Create Investigation. An initial status artifact is automatically added to the timeline. Begin adding artifacts as you work through the incident.
Investigation Properties
| Property | Values | Description |
|---|---|---|
| Status | open, agent-triage, investigating, closed | Current investigation state (agent-triage used by AI auto-triage) |
| Severity | low, medium, high, critical | Priority level for triage |
| Classification | true_positive, false_positive, inconclusive | Outcome classification; can be set at any time or when closing an investigation |
| Tags | Custom strings | Flexible labels for filtering |
| Resolution | Free text | Optional when closing; documents outcome |
Artifact Types
Investigations support 11 artifact types that can be added to the timeline:
| Type | Description | How to Add |
|---|---|---|
| Note | Text comments and observations (Markdown supported when displayed) | Add Note section on the investigation page |
| Indicators | Structured IOCs (IP, user, domain, hash, etc.) used for cross-investigation correlation | Indicators section in the investigation sidebar (+ icon) |
| Query | Links to specific queries | "Add to Investigation" from query results |
| Query Result | Captured query results with field filtering | "Add to Investigation" from query results |
| Alert | Security alerts related to the investigation | "Add to Investigation" from alert detail |
| Chat | AI Chat conversations | "Add to Investigation" from chat interface |
| Chat Message | Specific messages from chat conversations | "Add to Investigation" from chat interface |
| Link | External URLs and resources | Links sidebar on investigation page |
| Graph | Visual graph representations | "Add to Investigation" from graph view |
Notes
Notes are timeline artifacts with type note. The text you enter is stored in the artifact comment field and rendered on the timeline with Markdown support (headings, lists, code blocks, and links).
How notes work
- Use Add Note on the investigation detail page to post analysis, hypotheses, or handoff context.
- Notes are user-deletable (unlike system-generated investigation updates and resolutions).
- Notes do not carry structured metadata—everything lives in the comment text.
How notes and context reach the AI agent
Investigation notes are not pasted into the agent’s system prompt automatically. Agents read them the same way analysts do: by loading the full investigation when they need it.
Auto-triage (AI Triage on a detection)
When an alert opens an investigation, the triage agent starts with a fixed workflow prompt (alert ID, detection name, investigation ID). It is instructed to call InvestigationGet early in the run. That response includes:
- Investigation fields such as title, description, summary, status, severity, and classification
- The full timeline of artifacts in chronological order, including every note (
commenttext), linked alerts, queries, and system updates
So context you add in a timeline note or the investigation Description is available to the agent after it calls InvestigationGet. It is not guaranteed to be considered on the very first model turn before that tool runs.
| What you wrote | Where it lives | How the triage agent sees it |
|---|---|---|
| Timeline note (Add Note) | note artifact comment | Returned in InvestigationGet → artifacts list |
| Description (top of investigation page) | Investigation description field | Returned in InvestigationGet → investigation object |
| Comment when adding an artifact | That artifact’s comment | Same timeline in InvestigationGet |
| Detection notes (on the detection rule) | Detection config notes field | Prepended to the triage prompt at task start—not stored on the investigation timeline |
Detection notes are separate from investigation notes. They are author guidance on the detection (for example, “check CloudTrail for AssumeRole from this principal”) and are injected into the triage agent’s initial prompt when AI Triage runs. They do not appear as timeline notes. See Detection as Code (notes field) or the detection editor in the app.
Manual AI chat from an investigation
Actions such as Query Related or Auto-tune Detection open AI Chat with a seeded prompt that references the investigation ID. The chat does not embed your note text in that first message. The agent is expected to use investigation tools (especially InvestigationGet) to read notes, description, and artifacts before acting.
Practical tips
- Add Description or notes with playbook context before triage finishes (or before you retry a failed triage) if you want the agent to weigh that context during its first pass.
- Notes added after triage has completed are visible to later agent runs (retry triage, a new chat, or a custom agent with
InvestigationGet) but do not change an investigation that was already classified and closed. - For facts you want future investigations to find automatically, use indicators (structured IOCs), not note prose alone—IOC lookup does not search note text.
Notes vs indicators
| Note | Indicators | |
|---|---|---|
| Purpose | Narrative analysis and documentation | Structured pivot values for search and correlation |
| Storage | Free-form comment (Markdown) | Typed type + value pairs in artifact metadata |
| Cross-investigation lookup | No—search the timeline text manually | Yes—via IOC lookup (see below) |
When AI triage runs, it typically documents IOC correlation findings in a note (for example, prior investigations that used the same IP) and adds indicators separately when the alert is classified as a true positive, so those values can be found automatically in future cases.
Indicators and IOC correlation
Indicators let you record pivotable entities (IPs, users, domains, hashes, files, processes, URLs, and other free-form types) as structured data. Other investigations—and the AI triage agent—can then search for matching indicator values across your workspace.
Adding and managing indicators
On the investigation detail page, open the Indicators section in the sidebar:
- Click + to add an indicator.
- Enter a type (for example,
ip,user,domain,hash) and value. - Edit or remove indicators from the same section.
Indicators appear in the sidebar for quick reference; they are not duplicated in the main artifact timeline (timeline filtering excludes indicators artifacts from the default stream).
Multiple indicators can be stored in a single indicators artifact. Editing one indicator in a shared artifact updates that artifact’s indicator list.
How correlation works
Cross-investigation correlation is powered by the IOC lookup API (GET /investigations/ioc/lookup), which searches all indicators artifacts in the workspace:
- Match by IOC type (exact, for example
ip) - Match by IOC value (partial, case-insensitive)
- Optionally filter by parent investigation classification (
true_positive,false_positive,inconclusive)
Each result includes the investigation title, status, severity, classification, and when the indicator was recorded—so you can see whether the same entity appeared in earlier true positives or false positives.
Who uses IOC lookup today: Analysts manage indicators in the UI. AI agents (including the default auto-triage flow) call InvestigationIocLookup during triage to find prior matches before writing analysis notes. You can also query the same endpoint from the CLI (runreveal api investigations ioc-lookup).
Automated triage and correlation
When AI Triage is enabled on a detection, the triage agent generally:
- Analyzes the triggering alert and queries logs for context.
- Calls InvestigationIocLookup for suspicious entities (IP, user, domain, hash, and so on) to find prior investigations that tracked the same values.
- Adds a note summarizing the analysis, including any relevant prior-investigation context from step 2.
- For true positive classifications only, adds indicators for pivotable IOCs an analyst would search on later (not routine contextual fields such as generic internal IPs unless they matter to the alert).
IOC lookup searches indicators artifacts only—not note text. To make an entity discoverable across investigations, add it as an indicator (or rely on auto-triage to add indicators for true positives).
Working with Investigations
Adding Artifacts
Most RunReveal interfaces include an Add to Investigation action:
- From query results, alert details, chat sessions, or graphs, click Add to Investigation
- Select an existing investigation or create a new one
- Add an optional comment explaining relevance
- Click Add
Managing the Timeline
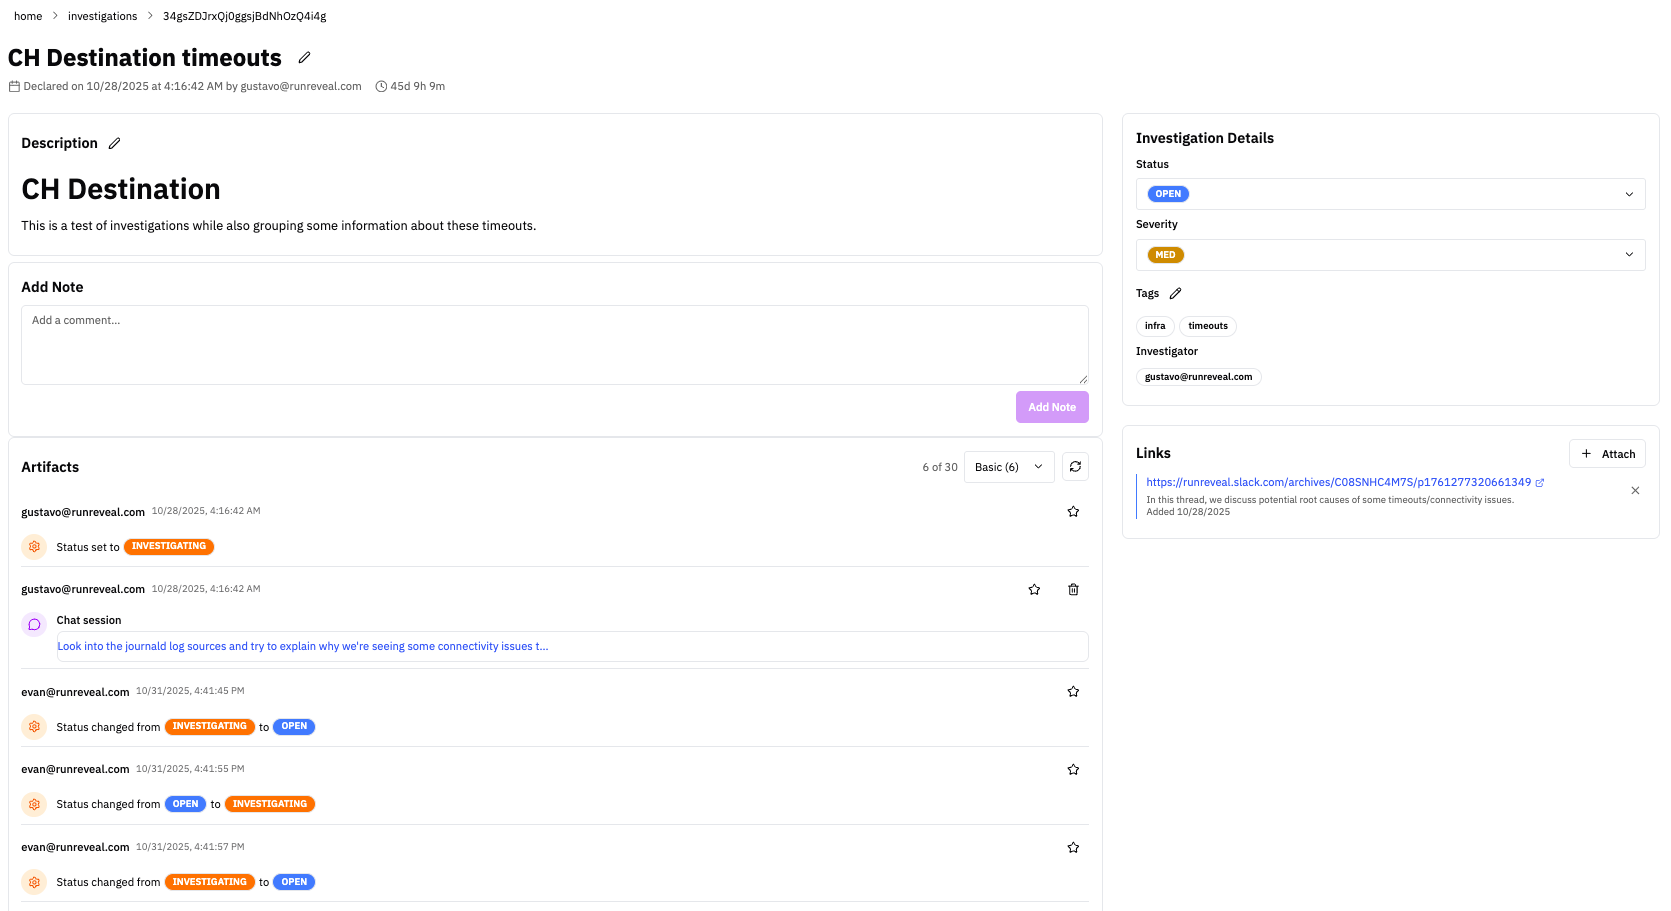
The investigation detail page provides:
- Header: Title, status, severity, classification, duration, metadata
- Description: Editable investigation context
- Add Note: Post Markdown-formatted notes to the timeline
- Indicators: Add, edit, and remove structured IOCs in the sidebar for cross-investigation correlation
- Artifact Timeline: Chronological view of all linked items
- Details Sidebar: Status, severity, classification, assignee, and tag management
- Links Sidebar: Quick links to external resources
Filtering and Starring
- Filter by type: Show only specific artifact types (alerts, queries, notes). Indicators are managed in the sidebar, not the main timeline filter list.
- Filter by starred: Surface important findings quickly
- Text search: Search across artifact comments and content
- Star artifacts: Hover over any artifact and click the star icon to highlight key findings
Classification
Investigations can be classified to record whether the triggering alert was a genuine threat or not. Classification can be set at any time from the investigation sidebar, or when closing an investigation via the resolution modal.
| Classification | When to use |
|---|---|
| True Positive | The alert identified a real security incident |
| False Positive | The alert was benign or incorrect |
| Inconclusive | There was not enough evidence to determine the outcome |
Classification is available as a filter on the investigations list page, making it easy to track detection accuracy over time and identify detections that need tuning.
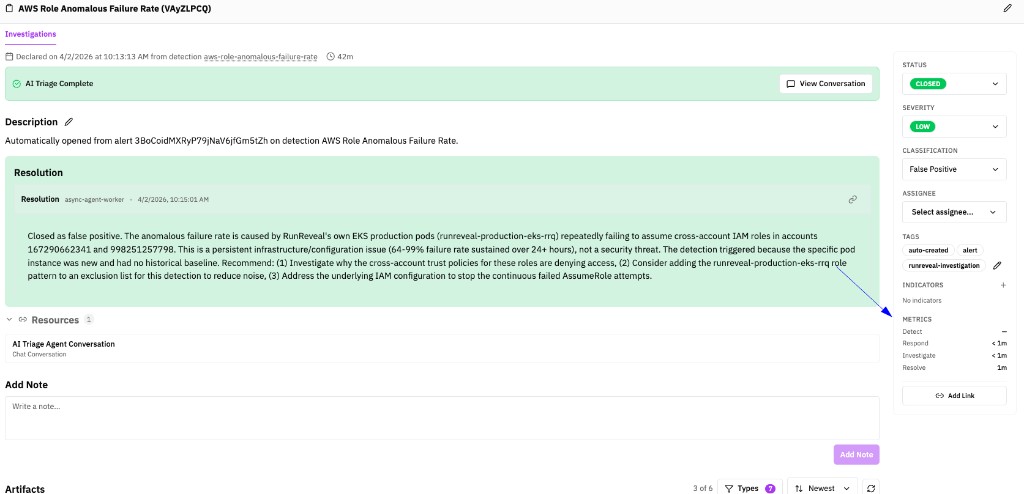
Time to Respond (MTTR)
Time to Respond (MTTR) and the value delivered by the AI triage agent - broken down by detection, response, investigation, and resolution stages.
This gives you a real-time view of how fast threats are being triaged and resolved, and quantifies the time savings the agent is delivering for your team.
| Metric | What it measures | How it's calculated |
|---|---|---|
| Detect | How quickly activity was surfaced as an alert after it occurred | The span between when the security-relevant activity happened and when your detection fired, based on timing from alerts tied to the investigation. |
| Respond | How long until someone first engaged with the investigation | Elapsed time from when the investigation was created until the first response milestone—such as assignment or moving into active triage. |
| Investigate | How long analysis and remediation work took after triage began | Elapsed time from when triage started through when the investigation was closed. |
| Resolve | End-to-end time from opening to closing the case | Elapsed time from investigation creation through closure and resolution. |
Closing Investigations
When changing status to closed:
- A resolution modal appears
- Select a classification (true positive, false positive, or inconclusive)
- Optionally enter resolution details
- Click Close Investigation
The classification and resolution are saved on the investigation, and a resolution artifact is automatically added to the timeline.
Automated Investigations
Automated investigations create and triage investigations when detection alerts fire, reducing manual work and accelerating incident response. You enable this per detection by turning on AI Triage and optionally choosing an Agent Configuration.
How Automated Investigations Work
When a detection alert fires and AI Triage is enabled for that detection:
-
Investigation Creation: RunReveal automatically creates a new investigation with:
- Title based on the detection name (with unique identifier)
- Alert artifact linking to the triggering alert
- Default severity (inherited from detection)
- Tags including
auto-created,alert - Status set to
open
-
AI-Powered Auto-Triage: An AI agent analyzes the alert:
- Updates status to
agent-triagewhile analyzing - Loads the investigation via
InvestigationGet(alert, description, and any existing timeline notes) - Reviews the alert data and queries additional context if needed
- Adds analysis notes to the investigation timeline
- Updates severity if the initial assessment was incorrect
- Makes a decision:
- Genuine threat: Updates status to
investigatingfor human review - False positive: Automatically closes the investigation with a classification and resolution notes
- Genuine threat: Updates status to
- Updates status to
Analyst context before triage: Timeline notes and the investigation Description are visible to the triage agent when it calls InvestigationGet. Detection notes on the rule are injected into the triage prompt directly. See How notes and context reach the AI agent for details.
Setting Up Automated Investigations
Enable AI Triage on a Detection
- Go to Detections and open the detection you want to automate.
- Edit Detection or Edit Subscribe to open the subscription form.
- Find the AI Triage section, turn AI Triage on, and under Agent Configuration choose an agent (or leave Default Triage Agent for the built-in agent). This connects the detection to the agent channel.
- Save the detection (subscribe or update subscription).
When this detection fires an alert, RunReveal will create an investigation and run the selected agent to triage it.
Automated Investigation Flow
Scenario: A detection for "Multiple Failed Login Attempts" fires an alert.
Detection configuration:
- AI Triage: On
- Agent Configuration: Default Triage Agent (or a custom agent)
What Happens:
-
Alert fires → Detection triggers for user
[email protected]with 15 failed logins from IP203.0.113.45 -
Investigation created:
- Title: "Multiple Failed Login Attempts (a1b2c3d4)"
- Status:
open - Severity: from detection
- Tags:
auto-created,alert - Alert artifact: Links to the triggering alert
-
AI agent triages:
- Status changes to
agent-triage - Agent analyzes the alert data
- Queries additional context: e.g. "Show all login attempts for [email protected] in last 24 hours"
- Checks IOC correlation: searches workspace indicators for entities from the alert (for example, whether
203.0.113.45appeared in prior investigations) - Adds note: documents analysis and any prior-investigation context from IOC lookup
- Adds indicators (true positives only): structured IOCs such as the source IP for future correlation
- Updates status to
investigating(requires human review)
- Status changes to
-
Analyst reviews:
- Opens investigation, sees AI analysis
- Reviews query results added by agent
- Takes action: Blocks IP, resets password
- Classifies as true positive and closes with resolution: "IP blocked, password reset, account secured"
Auto-Triage Behavior: When AI Triage is enabled, the AI agent focuses only on the specific alert that triggered the investigation. It does not search for or link additional alerts, keeping the investigation scope focused.
Example: Alert Investigation Agent (create with these settings)
An agent that triages detection alerts by parsing key fields, gathering log context, enriching indicators, and producing a risk assessment with recommended actions. Use it as the AI Triage agent on detections to automate investigation creation and initial analysis.
Expand: Agent configuration to create
Use the following when creating a new agent in Agents (e.g. for Agent Configuration in a detection’s AI Triage section).
| Setting | Value |
|---|---|
| Name | Alert Investigation Agent |
| Description | An agent that triages detection alerts by parsing key fields, gathering log context, enriching indicators, and producing a risk assessment with recommended actions. Use it as the AI Triage agent on detections to automate investigation creation and initial analysis. |
| AI Prompt | 1. Triage — Parse the alert for key fields (user, IP, action, timestamp, resource). Categorize the alert type and check for known false positive patterns. 2. Gather Context — Query logs to establish baseline behavior. What's normal for this user/system? What happened immediately before and after the alert? 3. Enrich Indicators — For any IPs, domains, or hashes, check reputation and whether they appear elsewhere in your environment. 4. Assess Risk — Weigh asset criticality, user privilege level, action severity, timing, and whether this behavior has been seen before. Use your judgment. 5. Conclude — Classify as: true positive (critical/high/medium), benign but suspicious, false positive, or insufficient data. 6. Report — Provide a brief summary, timeline of events, key evidence, and recommended actions. Use mermaid diagrams to visualize attack flows or timelines when helpful. Be direct. Lead with conclusions but don't assume something is malicious unless it is for sure malicious. Quantify observations. If you can't determine the answer, state exactly what additional data you need and provide next steps. If the detection / finding is bad, make recommendations for how to tune the alert. |
| Tools Needed | Add Investigation Artifact, Get Table Schema, Investigation Get, List Tables, Logs Query V3, Source List |
| Cron schedule | 0 9 * * * (9am daily, or your desired timeframe) |
| Scheduled Enabled | ON |
| Skip Permissions | ON |
Quick steps to attach to a detection (so the agent runs when the detection fires):
- Create the agent in Agents using the table above, then save.
- Go to Detections and open the detection you want to triage automatically.
- Edit Detection or Edit Subscribe to enable AI Triage for the detection and connect it to the agent channel.
- In the AI Triage section, turn AI Triage on and under Agent Configuration select Alert Investigation Agent (or the name you gave the agent).
- Save the detection (subscribe or update subscription).
When this detection fires an alert, RunReveal creates an investigation and runs the selected agent to triage it.
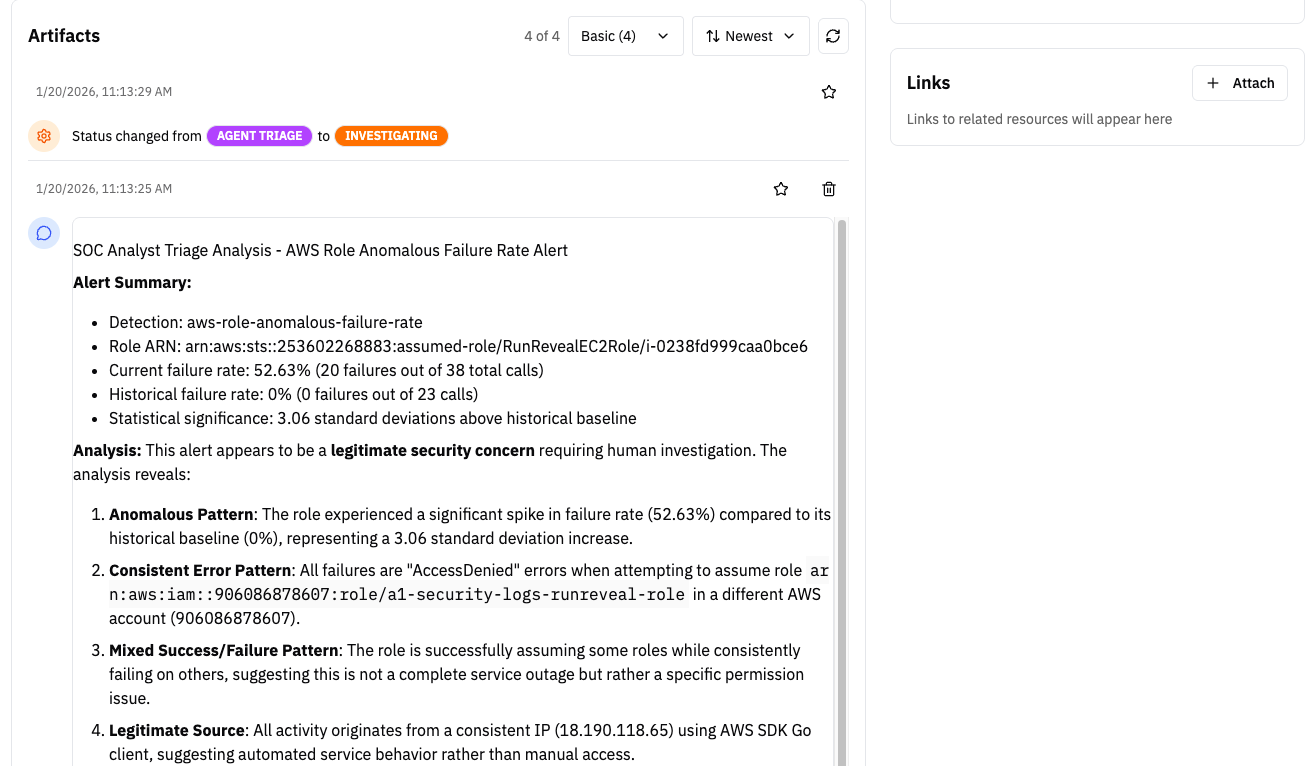
Type of response and artifact
The agent adds a Note artifact to the investigation timeline with a structured triage analysis. The note typically includes:
- Summary & conclusion — Classification (e.g. true positive, false positive, benign, or insufficient data) and a short narrative.
- Alert details — Detection name, severity, actor, event time, source IP, and related context.
- IOC correlation — Prior investigations that tracked the same indicators, when found via IOC lookup.
- Baseline / context — What’s normal for the user or system and how this event compares.
- Risk assessment — Factors (actor, timing, pattern, etc.) and overall risk level.
- Recommendations — Suggested next steps and, when the alert is noisy, detection tuning ideas. The agent may include mermaid diagrams for timelines or flow.
For true positive alerts, the agent may also add Indicators artifacts so key entities are searchable in future investigations.
Best Practices
Investigation Organization
- Descriptive titles: Use specific names like "2024-01-15 Brute Force from IP Range 192.168.x.x" rather than "Login Issue"
- Tag consistently: Establish team conventions for tags (e.g.,
authentication,malware,insider-threat) - Update status promptly: Move from
open→investigating→closedas work progresses - Classify on close: Always set a classification when closing to track detection accuracy
- Document resolution: Provide resolution details when closing for future reference
Artifact Management
- Add context: Include comments when adding artifacts explaining why they're relevant
- Star key findings: Use starring to highlight critical evidence
- Link comprehensively: Add all related queries, alerts, and chats to build complete context
- Use notes for analysis: Document your reasoning and hypotheses as you investigate; mention prior cases in prose when helpful
- Add indicators for pivotable IOCs: Use the sidebar so entities are findable via IOC lookup in future investigations—not only described in note text
Related Documentation
- Agents — Create and schedule AI agents, including for automated investigation triage
- Detections — Create detection rules that can trigger investigations
- Native AI Chat — Use AI to analyze data and add insights to investigations
- Explore Logs — Run queries and add results to investigations
- Notifications — Configure alerts that link to investigations
- Introducing RunReveal's Autonomous Security Operations Agent (blog) — AI agent for security operations, auto-triage, and incident response